As ever, if you have any questions about the below research, please do not hesitate to contact us.
The new funds for each Dynamic Portfolio will be listed below, or alternatively you can view the new funds on the designated Portfolio Library page.
Performance Graphs will be over a one-year period unless stated otherwise.
The Dynamic Portfolio’s below are sorted A-Z.
Commentary
There are three portfolios being updated this month, Dynamic Japan 3-Month, Dynamic UK Blended and Dynamic World ex-UK. All three did brilliantly with Japan up 13.59% over 3 months, UK Blended up 18.51% and World ex-UK up 22.41% both over 6 months.
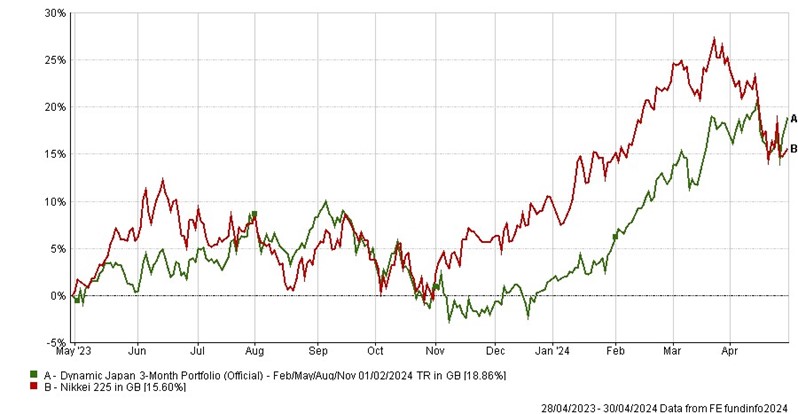
Starting with Japan, whilst it has taken a bit of a breather over the past month tracking a selloff on Wall Street, the Dynamic Japan 3-month figure is impressive. It returned over 11x the index in just 3 months. The large cap value style fund from Nomura remains the top performer and stays for the next period.
The long-term performance of this portfolio is even more impressive, up more than 405% since inception in 2000, which is more than 5x the index.
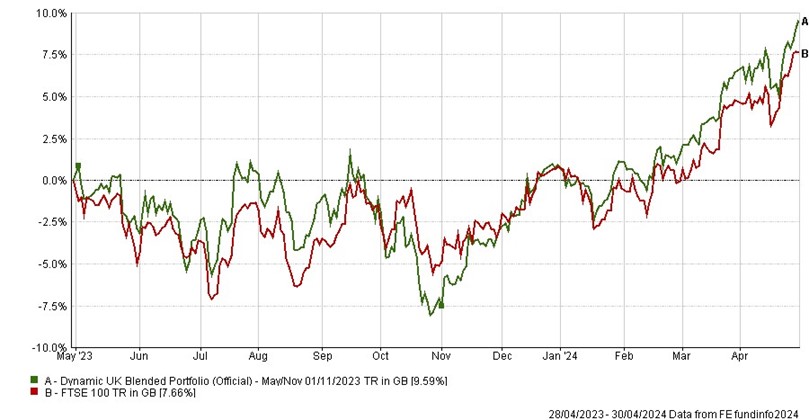
Turning to Dynamic UK Blended, the FTSE reached new record highs this month and overall it’s been a strong 6 months for this portfolio, which is up over 18.5% compared to the FTSE 100’s 13.38%.
This Dynamic Portfolio has returned over 1706% since inception in 2000 vs the FTSE 100 which has returned just over 205% over the same period. That’s over 8x the index.
For the 6 months ahead, we have a new selection of 3 funds.
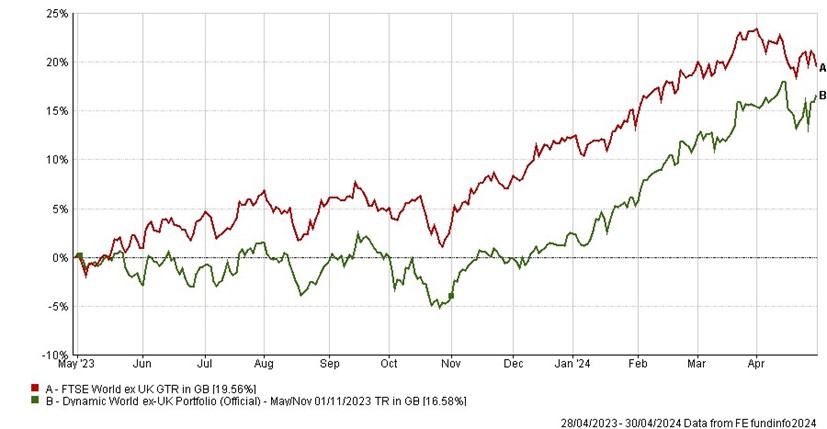
Finally Dynamic World ex-UK which was made up of 3 funds in America, Japan and Asia had a storming 6 months returning 22.41% compared to the FTSE World ex-UK up 17.36%.
Since launch this portfolio is up nearly double that of the index.
Looking ahead to the next 6 months the Japan fund stays, we have a different US fund but interestingly a UK small cap fund has appeared in the list.
- Dynamic Japan 3-Month
-
Dynamic Japan 3-Month Portfolio: up 13.59 %
Nikkei 225 Index: up 1.20 %
Annual Performance Chart
Performance Table
|
Name
|
3m
|
6m
|
1yr
|
3yr
|
5yr
|
Since Inception
(Feb 00)
|
|
Dynamic Japan 3-Month Portfolio
|
13.59
|
20.46
|
18.86
|
5.97
|
62.18
|
405.83
|
|
Nikkei 225 Index
|
1.20
|
15.01
|
15.60
|
2.38
|
26.36
|
74.86
|
Risk Table
|
Name
|
Worst Month
|
5 Year Volatility *
|
5-Year Monthly VaR**
|
|
Dynamic Japan 3-Month Portfolio
|
-17.55
|
17.66
|
-7.70
|
|
Nikkei 225 Index
|
-13.37
|
14.89
|
-8.48
|
Review Table
- Dynamic UK Blended Portfolio
-
6-Month Performance
Dynamic UK Blended Portfolio: up 18.51%
FTSE 100 Index: up 13.38%
Annual Performance Chart
Performance Table
|
Name
|
6m
|
1yr
|
3yr
|
5yr
|
Since Inception
(May 00)
|
|
Dynamic UK Blended Portfolio
|
18.51
|
9.59
|
11.67
|
50.70
|
1706.21
|
|
FTSE 100 Index
|
13.38
|
7.66
|
30.83
|
32.42
|
205.15
|
Risk
|
Name
|
Worst Month
|
5 Year Volatility *
|
5-Year Monthly VaR**
|
|
Dynamic UK Blended Portfolio
|
-16.35
|
15.44
|
-5.37
|
|
FTSE 100 Index
|
-13.41
|
13.78
|
-6.33
|
Review
- Dynamic World ex-UK Portfolio
-
6-Month Performance
Dynamic World ex-UK Portfolio: up 22.41 %
FTSE World ex-UK Index: up 17.36%
Annual Performance Chart
Performance Table
|
Name
|
6m
|
1yr
|
3yr
|
5yr
|
Since Inception
(May 00)
|
|
Dynamic World ex-UK Portfolio – May/Nov
|
22.41
|
16.58
|
0.90
|
52.18
|
879.40
|
|
FTSE World ex-UK Index
|
17.36
|
19.56
|
30.31
|
75.11
|
450.05
|
Risk
|
Name
|
Worst Month
|
5 Year Volatility *
|
5-Year Monthly VaR**
|
|
Dynamic World ex-UK Portfolio – May/Nov
|
-14.28
|
15.34
|
-6.99
|
|
FTSE World ex-UK Index
|
-12.60
|
13.50
|
-5.42
|
Review
*A measure of the size and frequency of short-term changes in the value of an investment.
**Monthly Value at Risk (VaR). A VaR of 6% means that in 19 months out of 20 you should not, on average, expect a fall in the capital value of more than 6% in any one month. The VaR of a typical UK stock market fund is 6%, for reference.
Performance data as of 30/04/2024