This is our most powerful tool for consistently improving your success as an investor seeking growth. In a nutshell they enable you to identify funds with outstanding potential.
Within FundExpert you will see that each fund has a rating, from 1 Star to 5 Star (click here if you are an income investor). The rating tells you if a fund should be bought (or sold) based on following a Dynamic Fund Selection process using Dynamic Fund Ratings.
For example, in theory a 5 Star rating means a high probability of extra growth compared to average. Moving beyond theory, the sector dropdowns below show you how successful it has been in practice, back to the 1990s.
Dynamic Fund Ratings - By Sector
We tested our Dynamic Fund Ratings sector by sector. Click on a sector below to see how much more growth you could have generated since the 1990s. The charts show the individual 5-year rolling performance for Dynamic Fund Selection (bluebars). The date shown is the end of each 5-year period, so if you see 1 July 2024 in the chart the blue bar shows the performance over the 5-year period from 1 July 2019 to 1 July 2024.
UK All Companies
UK All Companies funds invest at least 80% of their assets in UK equities which have a primary objective of achieving capital growth.
How effective is Dynamic Fund Ratings in this sector?
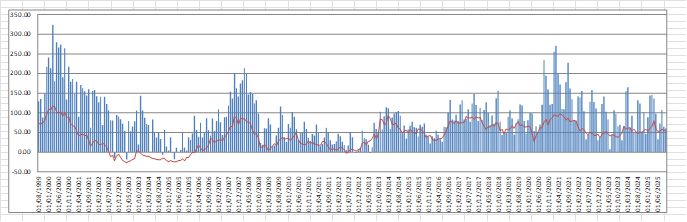
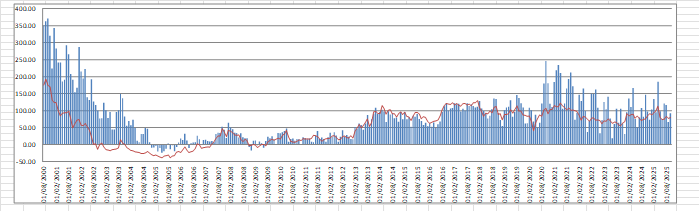
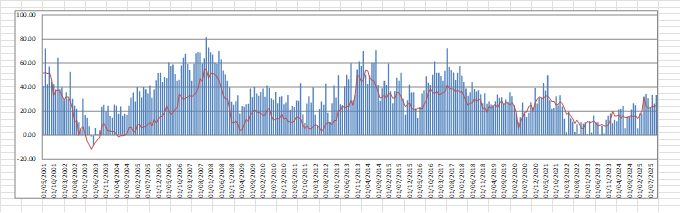
We tested the effectiveness of Dynamic Fund Ratings within the UK All Companies sector, analysing 315 five year periods since 1999. The results:
6.33% extra growth per annum - achieved by the Dynamic Fund Ratings vs the average sector fund
£3,590 average extra return after 5 years – from an £10,000 initial investment
87.62% chance of outperformance - Dynamic Fund Ratings outperformed in 276/315 five year periods
This is illustrated in the chart below. The blue columns represent the return of Dynamic Funds Ratings for each five year period since 1999. The red line represents the sector average. Wherever the blue column is higher than the red line Dynamic Fund Ratings outperformed the sector average.
Find the best momentum funds by searching for the sector here.
UK All Companies - Dynamic Fund Ratings vs. Sector Average Since 1999
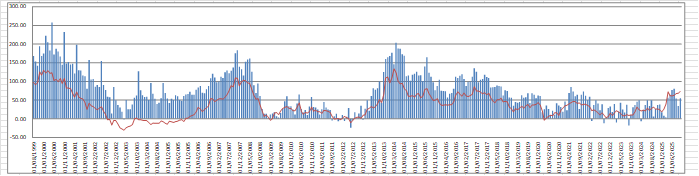
(Dynamic Portfolio: blue bars; Sector average: red line)
UK Equity Income
UK Equity Income funds invest at least 80% of their assets in UK equities which intend to achieve a historic yield in excess of 100% of the FTSE All Share yield on a 3 year rolling basis.
How effective is Dynamic Fund Ratings in this sector?
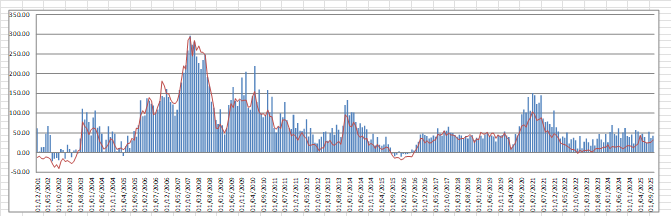
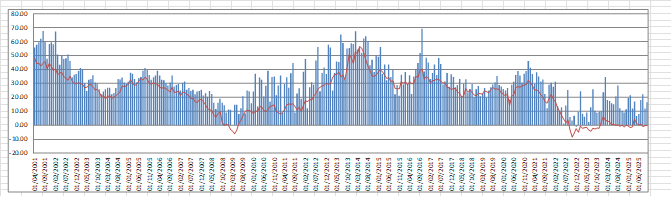
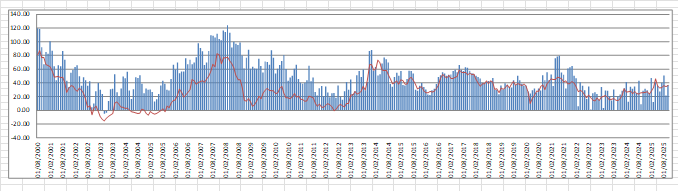
We tested the effectiveness of Dynamic Fund Ratings within the UK Equity Income sector, analysing 315 five year periods since 1999. The results:
3.30% extra growth per annum - achieved by the Dynamic Fund Ratings vs the average sector fund
£1,763 average extra return after 5 years – from an £10,000 initial investment
85.08% chance of outperformance - Dynamic Fund Ratings outperformed in 268/315 five year periods
This is illustrated in the chart below. The blue columns represent the return of Dynamic Funds Ratings for each five year period since 1999. The red line represents the sector average. Wherever the blue column is higher than the red line Dynamic Fund Ratings outperformed the sector average.
Find the best momentum funds by searching for the sector here.
UK Equity Income - Dynamic Fund Ratings vs. Sector Average Since 1999
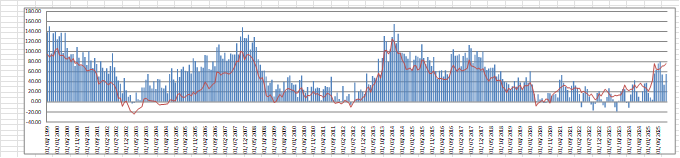
(Dynamic Portfolio: blue bars; Sector average: red line)
UK Smaller Companies
UK Smaller Companies funds invest at least 80% of their assets in equities of UK companies which form the bottom 10% by market capitalisation.
How effective is Dynamic Fund Ratings in this sector?
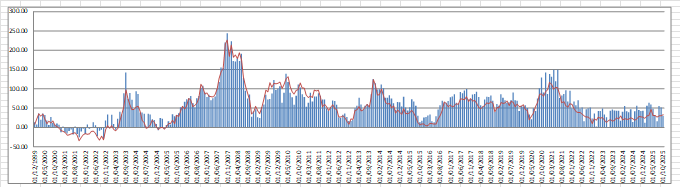
We tested the effectiveness of Dynamic Fund Ratings within the UK Smaller Companies, analysing 315 five year periods since 1999. The results:
9.00% extra growth per annum - achieved by the Dynamic Fund Ratings vs the average sector fund
£5,389 average extra return after 5 years – from an £10,000 initial investment
93.33% chance of outperformance - Dynamic Fund Ratings outperformed in 294/315 five year periods
This is illustrated in the chart below. The blue columns represent the return of Dynamic Funds Ratings for each five year period since 1999. The red line represents the sector average. Wherever the blue column is higher than the red line Dynamic Fund Ratings outperformed the sector average.
Find the best momentum funds by searching for the sector here.
UK Smaller Companies - Dynamic Fund Ratings vs. Sector Average Since 1999
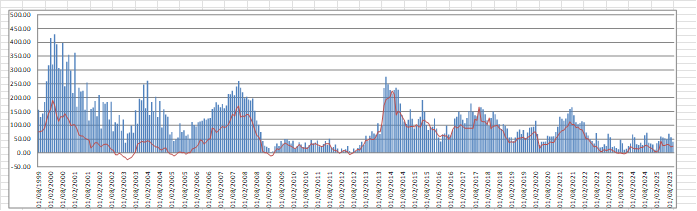
(Dynamic Portfolio: blue bars; Sector average: red line)
Europe ex-UK
Europe ex-UK funds invest at least 80% of their assets in European equities and exclude UK securities.
How effective is Dynamic Fund Ratings in this sector?
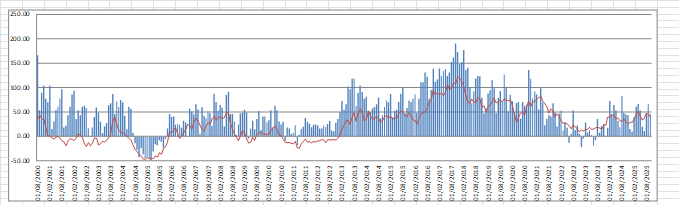
We tested the effectiveness of Dynamic Fund Ratings within the Europe ex-UK sector, analysing 315 five year periods since 1999. The results:
5.56% extra growth per annum - achieved by the Dynamic Fund Ratings vs the average sector fund
£3,108 average extra return after 5 years – from an £10,000 initial investment
96.19% chance of outperformance - Dynamic Fund Ratings outperformed in 291/315 five year periods
This is illustrated in the chart below. The blue columns represent the return of Dynamic Funds Ratings for each five year period since 1999. The red line represents the sector average. Wherever the blue column is higher than the red line Dynamic Fund Ratings outperformed the sector average.
Find the best momentum funds by searching for the sector here.
Europe ex-UK - Dynamic Fund Ratings vs. Sector Average Since 1999
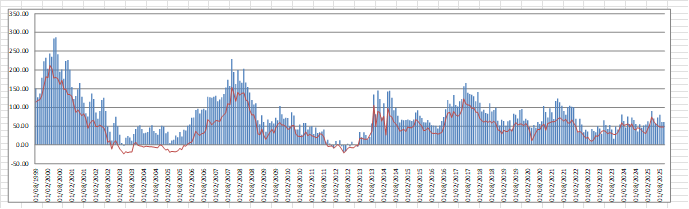
(Dynamic Portfolio: blue bars; Sector average: red line)
Global
Global funds invest at least 80% of their assets globally in equities. Funds must be diversified by geographic region.
How effective is Dynamic Fund Ratings in this sector?
We tested the effectiveness of Dynamic Fund Ratings within the Global sector, analysing 315 five year periods since 1999. The results:
7.90% extra growth per annum - achieved by the Dynamic Fund Ratings vs the average Global fund
£4,623 average extra return after 5 years – from an £10,000 initial investment
86.03% chance of outperformance - Dynamic Fund Ratings outperformed in 271/315 five year periods
This is illustrated in the chart below. The blue columns represent the return of Dynamic Funds Ratings for each five year period since 1999. The red line represents the sector average. Wherever the blue column is higher than the red line Dynamic Fund Ratings outperformed the sector average.
Find the best momentum funds by searching for the sector here.
Global - Dynamic Fund Ratings vs. Sector Average Since 1999
(Dynamic Portfolio: blue bars; Sector average: red line)
Global Emerging Markets
Global Emerging Markets funds invest at least 80% of their assets in emerging market equities.
How effective is Dynamic Fund Ratings in this sector?
We tested the effectiveness of Dynamic Fund Ratings within the Global Emerging Markets sector, analysing 287 five year periods since 2001. The results:
2.96% extra growth per annum - achieved by the Dynamic Fund Ratings vs the average sector fund
£1,570 average extra return after 5 years – from an £10,000 initial investment
80.84% chance of outperformance - Dynamic Fund Ratings outperformed in 232/287 five year periods
This is illustrated in the chart below. The blue columns represent the return of Dynamic Funds Ratings for each five year period since 2001. The red line represents the sector average. Wherever the blue column is higher than the red line Dynamic Fund Ratings outperformed the sector average.
Find the best momentum funds by searching for the sector here.
Global Emerging Markets - Dynamic Fund Ratings vs. Sector Average Since 2001
(Dynamic Portfolio: blue bars; Sector average: red line)
Asia Pacific ex-Japan
Asia Pacific ex-Japan funds invest at least 80% of their assets in Asia Pacific equities and exclude Japanese equities.
How effective is Dynamic Fund Ratings in this sector?
We tested the effectiveness of Dynamic Fund Ratings within the Asia Pacific ex-Japan sector, analysing 311 five year periods since 1999. The results:
1.69% extra growth per annum - achieved by the Dynamic Fund Ratings vs the average sector fund
£875 average extra return after 5 years – from an £10,000 initial investment
73.31% chance of outperformance - Dynamic Fund Ratings outperformed in 228/311 five year periods
This is illustrated in the chart below. The blue columns represent the return of Dynamic Funds Ratings for each five year period since 1999. The red line represents the sector average. Wherever the blue column is higher than the red line Dynamic Fund Ratings outperformed the sector average.
Find the best momentum funds by searching for the sector here.
Asia Pacific ex-Japan - Dynamic Fund Ratings vs. Sector Average Since 2000
(Dynamic Portfolio: blue bars; Sector average: red line)
Japan
Japan funds invest at least 80% of their assets in Japanese equities.
How effective is Dynamic Fund Ratings in this sector?
We tested the effectiveness of Dynamic Fund Ratings within the Japan sector, analysing 303 five year periods since 2000. The results:
4.81% extra growth per annum - achieved by the Dynamic Fund Ratings vs the average sector fund
£2,649 average extra return after 5 years – from an £10,000 initial investment
86.14% chance of outperformance - Dynamic Fund Ratings outperformed in 261/303 five year periods
This is illustrated in the chart below. The blue columns represent the return of Dynamic Funds Ratings for each five year period since 2000. The red line represents the sector average. Wherever the blue column is higher than the red line Dynamic Fund Ratings outperformed the sector average.
Find the best momentum funds by searching for the sector here.
Japan - Dynamic Fund Ratings vs. Sector Average Since 2000
(Dynamic Portfolio: blue bars; Sector average: red line)
North America
North America funds invest at least 80% of their assets in North American Equities.
How effective is Dynamic Fund Ratings in this sector?
We tested the effectiveness of Dynamic Fund Ratings within the North America sector, analysing 303 five year periods since 2000. The results:
5.22% extra growth per annum - achieved by the Dynamic Fund Ratings vs the average sector fund
£2,897 average extra return after 5 years – from an £10,000 initial investment
70.96% chance of outperformance - Dynamic Fund Ratings outperformed in 215/303 five year periods
This is illustrated in the chart below. The blue columns represent the return of Dynamic Funds Ratings for each five year period since 2000. The red line represents the sector average. Wherever the blue column is higher than the red line Dynamic Fund Ratings outperformed the sector average.
Find the best momentum funds by searching for the sector here.
North America - Dynamic Fund Ratings vs. Sector Average Since 2000
(Dynamic Portfolio: blue bars; Sector average: red line)
Sterling Corporate Bond
Sterling Corporate Bond funds invest at least 80% of their assets in Sterling denominated corporate bond securities, rated Triple B minus or above.
How effective is Dynamic Fund Ratings in this sector?
We tested the effectiveness of Dynamic Fund Ratings within the Sterling Corporate Bond sector, analysing 294 five year periods since 2001. The results:
1.78% extra growth per annum - achieved by the Dynamic Fund Ratings vs the average sector fund
£922 average extra return after 5 years – from an £10,000 initial investment
92.54% chance of outperformance - Dynamic Fund Ratings outperformed in 273/294 five year periods
This is illustrated in the chart below. The blue columns represent the return of Dynamic Funds Ratings for each five year period since 2001. The red line represents the sector average. Wherever the blue column is higher than the red line Dynamic Fund Ratings outperformed the sector average.
Find the best momentum funds by searching for the sector here.
Sterling Corporate Bond - Dynamic Fund Ratings vs. Sector Average Since 2001
(Dynamic Portfolio: blue bars; Sector average: red line)
Sterling Strategic Bond
Sterling Strategic Bond funds invest at least 80% of their assets in sterling denominated fixed income securities.
How effective is Dynamic Fund Ratings in this sector?
We tested the effectiveness of Dynamic Fund Ratings within the Sterling Strategic Bond sector, analysing 257 five year periods since 2004. The results:
2.58% extra growth per annum - achieved by the Dynamic Fund Ratings vs the average sector fund
£1,360 average extra return after 5 years – from an £10,000 initial investment
87.94% chance of outperformance - Dynamic Fund Ratings outperformed in 226/257 five year periods
This is illustrated in the chart below. The blue columns represent the return of Dynamic Funds Ratings for each five year period since 2004. The red line represents the sector average. Wherever the blue column is higher than the red line Dynamic Fund Ratings outperformed the sector average.
Find the best momentum funds by searching for the sector here.
Sterling Strategic Bond - Dynamic Fund Ratings vs. Sector Average Since 2004
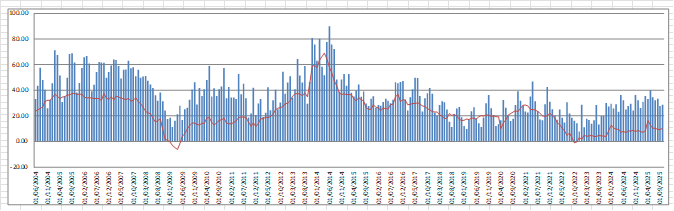
(Dynamic Portfolio: blue bars; Sector average: red line)
Flexible Investment
The funds in this sector are expected to have a range of different investments. However, the fund manager has significant flexibility over what to invest in. There is no minimum or maximum requirement for investment in company shares (equities) and there is scope for funds to have a high proportion of shares.
How effective is Dynamic Fund Ratings in this sector?
We tested the effectiveness of Dynamic Fund Ratings within the Flexible Investment sector, analysing 303 five year periods since 2000. The results:
2.94% extra growth per annum - achieved by the Dynamic Fund Ratings vs the average sector fund
£1,559 average extra return after 5 years – from an £10,000 initial investment
79.54% chance of outperformance - Dynamic Fund Ratings outperformed in 241/303 five year periods
This is illustrated in the chart below. The blue columns represent the return of Dynamic Funds Ratings for each five year period since 2000. The red line represents the sector average. Wherever the blue column is higher than the red line Dynamic Fund Ratings outperformed the sector average.
Find the best momentum funds by searching for the sector here.
Flexible Investment - Dynamic Fund Ratings vs. Sector Average Since 2000
(Dynamic Portfolio: blue bars; Sector average: red line)
Mixed 20-60% Shares
Funds in this sector are required to have a range of different investments. The fund must have between 20% and 60% invested in company shares (equities). At least 30% of the fund must be in fixed income investments (for example, corporate and Government bonds) and/or “cash” investments. “Cash” can include investments such as current account cash, short-term fixed income investments and certificates of deposit.
How effective is Dynamic Fund Ratings in this sector?
We tested the effectiveness of Dynamic Fund Ratings within the Mixed 20-60% Shares sector, analysing 294 five year periods since 2001. The results:
2.25% extra growth per annum - achieved by the Dynamic Fund Ratings vs the average sector fund
£1,179 average extra return after 5 years – from an £10,000 initial investment
84.01% chance of outperformance - Dynamic Fund Ratings outperformed in 247/294 five year periods
This is illustrated in the chart below. The blue columns represent the return of Dynamic Funds Ratings for each five year period since 2001. The red line represents the sector average. Wherever the blue column is higher than the red line Dynamic Fund Ratings outperformed the sector average.
Find the best momentum funds by searching for the sector here.
Mixed 20-60% Shares - Dynamic Fund Ratings vs. Sector Average Since 2001
(Dynamic Portfolio: blue bars; Sector average: red line)
Mixed 40-85% Shares
Funds in this sector are required to have a range of different investments. However, there is scope for funds to have a high proportion in company shares (equities). The fund must have between 40% and 85% invested in company shares.
How effective is Dynamic Fund Ratings in this sector?
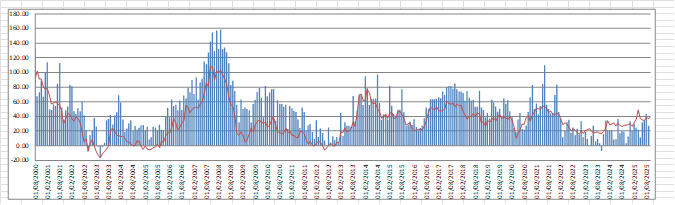
We tested the effectiveness of Dynamic Fund Ratings within the Mixed 40-85% Shares sector, analysing 303 five year periods since 2000. The results:
3.47% extra growth per annum - achieved by the Dynamic Fund Ratings vs the average sector fund
£1,858 average extra return after 5 years – from an £10,000 initial investment
86.47% chance of outperformance - Dynamic Fund Ratings outperformed in 262/303 five year periods
This is illustrated in the chart below. The blue columns represent the return of Dynamic Funds Ratings for each five year period since 2000. The red line represents the sector average. Wherever the blue column is higher than the red line Dynamic Fund Ratings outperformed the sector average.
Find the best momentum funds by searching for the sector here.
Mixed 40-85% Shares - Dynamic Fund Ratings vs. Sector Average Since 2000
(Dynamic Portfolio: blue bars; Sector average: red line)