As ever, if you have any questions about the below research please do not hesitate to contact us.
The new funds for each Dynamic Portfolio will be listed below, or alternatively you can view the new funds on the designated Portfolio Library page.
Performance Graphs will be over one-year period unless stated otherwise.
The Dynamic Portfolio’s below are sorted A-Z.
Commentary
There are four Dynamic Portfolios up for review this month, a fascinating bunch:
- 3-Month Bonkers
- Dynamic Commodities
- Dynamic Global
- Dynamic UK Smaller
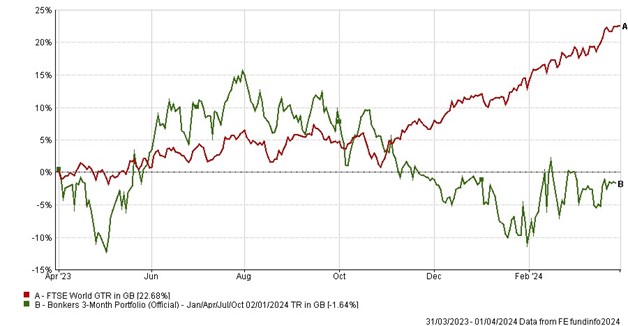
3-Month Bonkers is up very slightly over the period, which is hardly surprising when you consider it held the ARK Disruptive Innovation fund. Such a fund should (in theory) have flown upwards with the World index (up more than 9%, driven by tech and AI).
This slightly crazy portfolio is always likely to generate some weird and wonderful short-term plays, though it has still outperformed the index by a multiple of nearly 9 since launch in 1999.
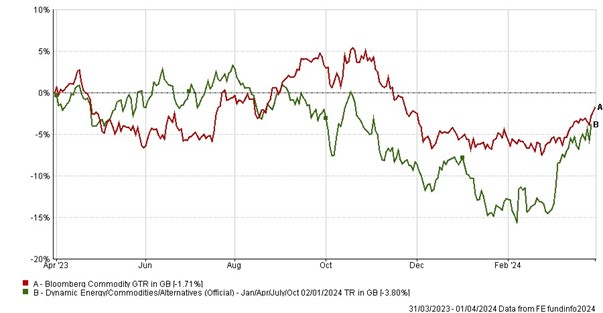
Dynamic Commodities, also with a 3-month review, is up more than 5%, and a bit better than the index. The gold funds did the trick.
The long-term performance is impressive, at 26x the index, but the universe we have created make it notably more volatile than the index.
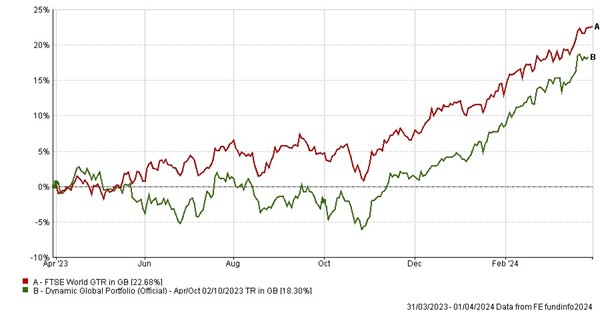
The much more conventional Dynamic Global Portfolio is up more than 20% in the 6 months, from a neat selection of the US, Japan, and Value.
The long-term growth is more than 3x the index.
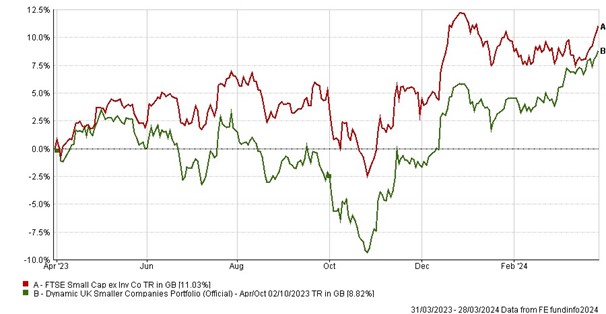
The Dynamic UK Smaller portfolio is a long-term favourite, and has grown more than 11% in the 6 months, twice the index.
Since inception in 1999 it has growth nearly 7x more than the equivalent index.
- Bonkers 3-Month Portfolio
-
3-Month Performance
Bonkers 3-Month Portfolio: up 0.29%
FTSE World Index: up 9.56%
Annual Performance Chart
Performance Table
|
Name
|
3m
|
6m
|
1yr
|
3yr
|
5yr
|
Since Inception
(Oct 99)
|
|
Bonkers 3-Month Portfolio
|
0.29
|
-10.77
|
-1.64
|
-29.55
|
-8.42
|
4934.51
|
|
FTSE World Index
|
9.56
|
17.12
|
22.68
|
39.79
|
83.87
|
566.63
|
Risk Table
|
Name
|
Worst Month
|
5 Year Volatility *
|
5-Year Monthly VaR**
|
|
Bonkers 3-Month Portfolio
|
-25.97
|
24.96
|
-14.10
|
|
FTSE World Index
|
-12.52
|
13.32
|
-5.32
|
Review Table
- Dynamic Commodities Portfolio
-
3-Month Performance
Dynamic Commodities Portfolio: up 5.28%
Bloomberg Commodity Index: up 3.09%
Annual Performance Chart
Performance Table
|
Name
|
3m
|
6m
|
1yr
|
3yr
|
5yr
|
Since Inception
(Jan 09)
|
|
Dynamic Commodities Portfolio
|
5.28
|
-1.83
|
-3.80
|
34.16
|
124.15
|
346.73
|
|
Bloomberg Commodity Index
|
3.09
|
-5.84
|
-1.71
|
41.88
|
40.56
|
13.29
|
Risk
|
Name
|
Worst Month
|
5 Year Volatility *
|
5-Year Monthly VaR**
|
|
Dynamic Commodities Portfolio
|
-14.59
|
22.36
|
-7.81
|
|
Bloomberg Commodity Index
|
-10.88
|
14.50
|
-6.79
|
Review
- Dynamic Global Portfolio – Apr/Oct
-
6-Month Performance
Dynamic Global Portfolio: up 20.16%
FTSE World Index: up 17.12 %
Annual Performance Chart
Performance Table
|
Name
|
6m
|
1yr
|
3yr
|
5yr
|
Since Inception
(Oct 99)
|
|
Dynamic Global Portfolio – Apr/Oct
|
20.16
|
18.30
|
12.77
|
102.85
|
1790.78
|
|
FTSE World Index
|
17.12
|
22.68
|
39.79
|
83.87
|
566.53
|
Risk
|
Name
|
Worst Month
|
5 Year Volatility *
|
5-Year Monthly VaR**
|
|
Dynamic Global Portfolio – Apr/Oct
|
-14.62
|
14.74
|
-5.87
|
|
FTSE World Index
|
-12.52
|
13.32
|
-5.32
|
Review
- Dynamic UK Smaller Companies Portfolio
-
6-Month Performance
Dynamic UK Smaller Companies Portfolio: up 11.68%
FTSE Small Cap (ex IT): up 5.44%
Annual Performance Chart
Performance Table
|
Name
|
6m
|
1yr
|
3yr
|
5yr
|
Since Inception
(Oct 99)
|
|
Dynamic UK Smaller Companies Portfolio
|
11.68
|
8.82
|
-5.40
|
43.73
|
2042.27
|
|
FTSE Small Cap (ex IT)
|
5.44
|
11.03
|
2.01
|
34.94
|
296.47
|
Risk
|
Name
|
Worst Month
|
5 Year Volatility *
|
5-Year Monthly VaR**
|
|
Dynamic UK Smaller Companies Portfolio
|
-22.39
|
19.70
|
-4.88
|
|
FTSE Small Cap (ex IT)
|
-25.79
|
21.04
|
-5.49
|
Review
*A measure of the size and frequency of short term changes in the value of an investment.
**Monthly Value at Risk (VaR). A VaR of 6% means that in 19 months out of 20 you should not, on average, expect a fall in the capital value of more than 6% in any one month. The VaR of a typical UK stock market fund is 6%, for reference.
Performance data as of 31/03/2024