The new funds for each Dynamic Portfolio are listed below. Alternatively you can view the new funds on the designated Portfolio Library page – importantly, by following this link, you will also see how each portfolio is built.
Performance graphs below are over a one-year period unless stated otherwise.
The Dynamic Portfolio’s below are sorted A-Z.
Commentary
Three interesting updates for this month.
Looking back over 3-6 months, in October markets appeared to be on the brink and everyone was holding their breath. Then from the end of October the tide turned, along with improved numbers on inflation, creating the possibility of interest rates falling faster than expected. Then in mid December the US Federal Reserve fuelled the enthusiasm of the more manic investors (talk of even earlier rate cuts) and the big tech funds, Magnificent Seven, took off and upward.
Here are todays portfolios for update:
- Dynamic Japan Portfolio
- Dynamic UK Blended
- Dynamic World ex-UK
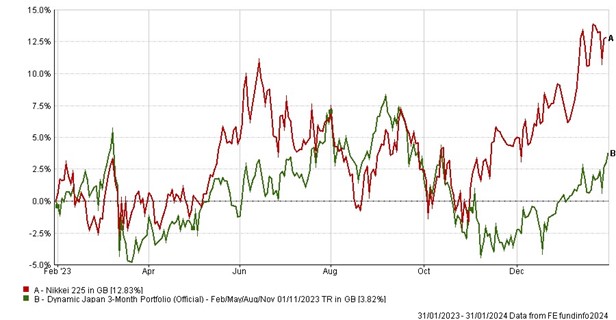
A positive period for Japan. Remember the review period is 3 months for Dynamic Japan, an exception to our norm. It was a decent return of 4.5%, but the big cap dominated Nikkei index flew upwards with New Year buying by global institutions.
It remains a superb Dynamic portfolio, focused on an area which is cheap, and which has outperformed the index by a multiple of 4.8 since inception.
The switch is to a Japan Value fund for the next 3 months.
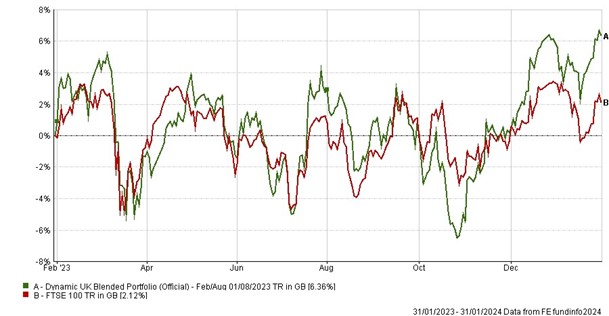
Dynamic UK Blended is up 3.49%, outperforming the FTSE 100 index. Since inception in 2000 it has grown 4.7x the index.
Two of the new selections have a mid-cap focus, which is more about confidence in the UK economy than the large cap constituents of the FTSE 100, which are mostly global.
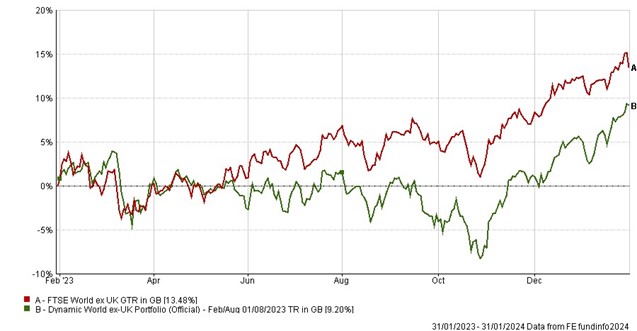
The Dynamic World ex-UK portfolio was best, up 7.49%. It just outperformed the World Index, which was impressive bearing in mind the index will have been driven by big tech, which would have had a limited exposure in our portfolio. Since inception it has performed a little over twice as well as the index.
Not surprisingly two of the three new selections are US-focussed.
This is an interesting portfolio, and we recommend checking out the way it is structured here.
- Dynamic Japan 3-Month Portfolio
-
3-Month Review
Dynamic Japan 3-Month Portfolio: up 4.50%
Nikkei 225 Index: up 14.69%
Annual Performance Chart
Performance Table
|
Name
|
3m
|
6m
|
1yr
|
3yr
|
5yr
|
Since Inception
(Feb 00)
|
|
Dynamic Japan 3-Month Portfolio
|
4.50
|
-2.24
|
3.82
|
2.08
|
48.32
|
348.87
|
|
Nikkei 225 Index
|
14.69
|
6.13
|
12.83
|
0.09
|
32.72
|
72.78
|
Risk Table
|
Name
|
Worst Month
|
5 Year Volatility *
|
5-Year Monthly VaR**
|
|
Dynamic Japan 3- Month Portfolio
|
-17.55
|
17.54
|
-8.67
|
|
Nikkei 225 Index
|
-14.49
|
14.22
|
-8.73
|
Review Table
- Dynamic UK Blended Portfolio
-
6-Month Performance
Dynamic UK Blended Portfolio: up 3.49%
FTSE 100: up 0.85%
Annual Performance Chart
Performance Table
|
Name
|
6m
|
1yr
|
3yr
|
5yr
|
Since Inception
(Feb 00)
|
|
Dynamic UK Blended Portfolio
|
3.49
|
6.36
|
28.09
|
41.88
|
876.26
|
|
FTSE 100
|
0.85
|
2.12
|
33.20
|
32.33
|
186.08
|
Risk Table
|
Name
|
Worst Month
|
5 Year Volatility *
|
5-Year Monthly VaR**
|
|
Dynamic UK Blended Portfolio
|
-21.83
|
18.59
|
-7.18
|
|
FTSE 100
|
-13.41
|
13.71
|
-7.74
|
Review Table
- Dynamic World ex-UK Portfolio
-
6-Month Performance
Dynamic World ex-UK Portfolio: up 7.49%
FTSE World ex-UK Index: up 6.55%
Annual Performance Chart
Performance Table
|
Name
|
6m
|
1yr
|
3yr
|
5yr
|
Since Inception
(Feb 00)
|
|
Dynamic World ex-UK Portfolio
|
7.49
|
9.20
|
17.57
|
88.73
|
955.25
|
|
FTSE World ex-UK Index
|
6.55
|
13.48
|
35.93
|
80.54
|
459.59
|
Risk Table
|
Name
|
Worst Month
|
5 Year Volatility *
|
5-Year Monthly VaR**
|
|
Dynamic World ex-UK Portfolio
|
-14.81
|
13.72
|
-6.20
|
|
FTSE World ex-UK Index
|
-12.60
|
13.30
|
-5.74
|
Review Table
*A measure of the size and frequency of short-term changes in the value of an investment.
**Monthly Value at Risk (VaR). A VaR of 6% means that in 19 months out of 20 you should not, on average, expect a fall in the capital value of more than 6% in any one month. The VaR of a typical UK stock market fund is 6%, for reference.
Performance data as of 31/01/2024