 Originally the focus of FundExpert’s research was unit trusts, and in recent years we expanded our offering to incorporate investment trusts (ITs) into our research.
Now, with an abundance of ETFs entering the UK market, we feel it is an appropriate time to begin seeing how ETFs can add value for investors, and whether and to what extent they can be incorporated into our analysis. We start today by exploring a Global ETF portfolio and comparing it with our own Dynamic Global Portfolio.
Firstly, what are ETFs?
Exchange Traded Funds (ETFs) offer investors a way to invest in a wide range of bonds or shares within one fund, as well as niche areas such as commodities and crypto. They'll typically track a specific index, like the FTSE 100. Unlike unit trusts, ETFs are traded on the stock market. That means you can buy or sell them at any time during the day.
The increase in popularity of ETFs is due to a combination of 3 main factors:
- Their low cost
- Their ability to invest into very niche and specialist sectors (mainly in the US for now, but this will no doubt expand)
- Their ability to offer both active and passive management strategies
What we did
We created a custom universe with ETFs from mainstream stock market sectors, and stuck to our classic 6-monthly review cycle of switching into the top 3 best performing funds, every 6 months.
The only caveat is that the ETFs chosen must be greater than £50m in size, and the chosen funds must be from different sectors e.g. at a review point if the best two funds are from the North America sector, we will pick only the best fund and then pick the next best ETF, not from the North America sector.
The sectors considered are:
Asia Pacific Excluding Japan, China/Greater China, Europe Excluding UK, Europe Including UK, European Smaller Companies, Global, Global Emerging Markets, Global Equity Income, India/Indian Subcontinent, Japan, Japanese Smaller Companies, North America, North American Smaller Companies, UK All Companies, UK Equity Income, UK Smaller Companies.
You may notice there are a few more sectors above than in our official Dynamic Global Portfolio, this is so that we could increase the size of the universe, as there were not many ETFs around back in 2007 that met our initial criteria.
The Results – Performance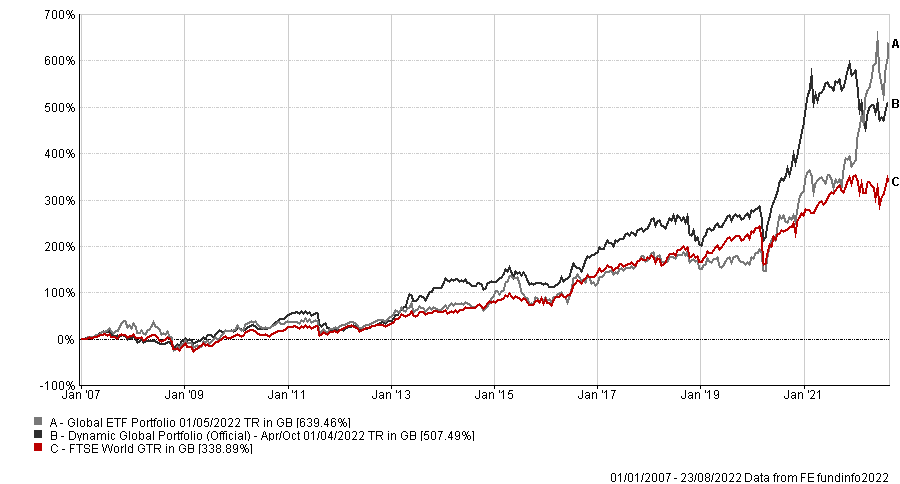
As you will see from the graph above, the Global ETF Portfolio (grey line) closely follows the FTSE World Index (red line) throughout much of the period, and slightly outperforms it through the majority of 2007 – 2015. However, and perhaps most importantly, the ETF Portfolio consistently underperforms our Dynamic Global Portfolio. Only from the COVID-19 recovery in 2020 did the ETF Portfolio overtake it, and it did so because it was holding ETFs in niche sectors such as cryptocurrency and renewable energy, both of which saw exponential growth throughout 2020 and much of 2021.
Another large-ish spike (and then subsequent fall) of the ETF Portfolio compared to the FTSE World was at the start of 2015. This is due to the portfolio buying into the Xtrackers Harvest CSI300 ETF which reflects the performance of 300 companies on the Shanghai & Shenzhen stock exchange. The portfolio bought in at end of the 2014, and saw a huge 92% total return over the subsequent 6-month period. However, shortly after the Chinese stock market crashed due to a growing debt crisis, hence the rather large fall you can see below for the red line midway through 2015!
From 2017 the FTSE World does mostly outperform the ETF Portfolio until the COVID recovery. One of the contributing factors was that the ETF Portfolio had a consistently large weighting to the North America sector, which drifted while the US-Sino trade war was unfolding.
The Results - Risk
| |
5-year Volatility*
|
Monthly Value at Risk**
|
Worst Month***
|
|
Dynamic Global Portfolio
|
15.63
|
-7.2
|
-12.65
|
|
FTSE World
|
13.34
|
-6.43
|
-11.21
|
|
Global ETF Portfolio
|
19.06
|
-8.24
|
-16.11
|
Unsurprisingly, from looking at the trends on the graph above, the Global ETF Portfolio has a higher volatility than that of the Dynamic Global Portfolio and FTSE World. The Global ETF Portfolio actually has a volatility closer to that of our Dynamic Bonkers Portfolio! The VaR and worst month figures are also unsurprisingly higher for the ETF Portfolio as well.
Based on a fairly simple performance and risk analysis, you can see just how wild some of the movements are in our Global ETF Portfolio. This isn’t to say that all ETFs move in a similar fashion, and it results from us creating a very diverse universe e.g. including India, China and Global EM, crypto and energy.
We will continue to delve deeper into ETFs in the coming weeks and months, and if you have any specific suggestions or queries regarding ETFs or potential research projects, please feel free to let us know.
*The measure of the size and frequency of short-term changes in the value of an investment.
**Monthly Value at Risk (VaR). A VaR of 6% means that in 19 months out of 20 you should not, on average, expect a fall in the capital value of more than 6% in any one month. The VaR of a typical UK stock market fund is 6%, for reference.
***Worst monthly return since 2007.