It is strange that maths might be able to map the psychology of investors, over both short periods and long. Yet this is at the heart of Elliott Wave Theory.
In November there was a two-parter on Elliott Wave, both the theory, and current analysis, which identified the recent peak to within less than 1% on the US stock market.
Today I want to use Fibonacci numbers to reach back from 2021 to earlier years in history.
As you will see, the results are both spooky, and ring a loud warning from history to which you must pay attention.
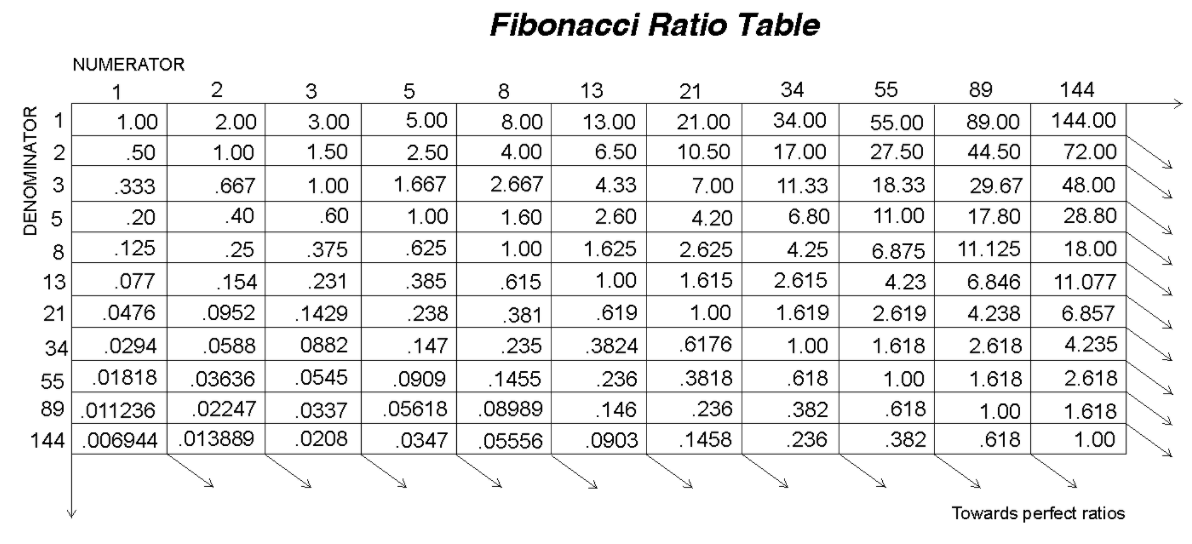
Fibonacci And The Golden Ratio
Mathematicians, scientists, and naturalists have known about the Golden Ratio for centuries, which is derived from the Fibonacci sequence, named after the Italian mathematician, Leonardo Fibonacci (1170-1250).
It is the simplest of sequences, where each number is no more than the sum of the two preceding numbers (1, 1, 2, 3, 5, 8, 13, 21, 34 etc). Some say this sequence is not all that important, and that it is the ratio connecting these numbers which is key – roughly 1.618, or its inverse 0.618. This is the Golden Ratio. You can see the Fibonacci Ratio Table at the end of this blog.
This ratio is referred to as the building block of nature, and you can see lots more on that here – fascinating stuff. But it is that number sequence which is my focus today, rather than the application of the ratio itself.
Investment Cycles
Since the 1980s there have always been corners of the investment industry proclaiming the end of the world as we know it, and financial Armageddon, based on some cycle or another – 7 or 14 years, 50 or 60 etc. Despite my own scepticism, it is one of those cycles, governed by those Fibonacci numbers, that I will touch on today.
There is also a more self-evident 40 year cycle now ending.
The extremes of 2021 did imply that 2021 might be important, in particular if it marked the end of a 40 year collapse in interest rates. That 40 year trend of cheap and easy money is the indispensable component of the prevailing investment bubble and mania in the US, the likes of which, arguably, have never before been seen.
Grasping the latter is very important for you and I as investors, because reversing that trend will involve pain, to say the least, and many investors will endure significant wealth destruction. That is not me being melodramatic – that is how history informs us, and you ignore that lesson at your peril.
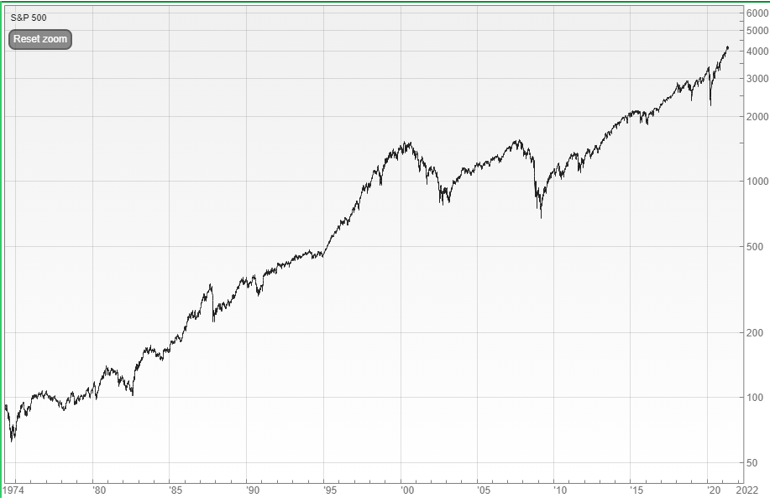
There was an important stock market low in 1972/3 which is the seed from which this crazy bull market grew. The denouement of just that stock market uptrend, bull market, is represented in the chart at the end, one which I have shown many times. The straightforward Elliott Wave analysis shown on that graph implies falls of 60-80% - which is what the stock market history of the last two centuries also warns is coming. But, as I always say too, we have no idea when…
…well, not really, but…
Joining The Dots With 2021
If 2021 was an important peak, you might see a string of prior turning points linked to 2021 by the Fibonacci number sequence – that is what I wanted to test today. The results are fascinating!
Starting with the lucky 13 Fibonacci number, this is how the sequence links back in time (and see the top line of the table at the end for the sequence):
13 years ago: 2008 Crash
The biggest financial crash since the 1930s, and the worlds financial infrastructure was on the brink.
21 years ago: 2000 Tech Bubble Peak
The biggest stock market bubble since the 18th century.
34 years ago: 1987 Peak and Crash
The biggest one day fall since the 1929 Crash.
55 years ago: 1966 US Stock Market Peak
The US stock market hit a peak of 990 (Dow Jones Industrial), and then went sideways and down for the next 17 years, until reaching 990 again in December of 1982.
89 years ago: 1932 low after Wall Street Crash
This was the low point following on from the Wall Street Crash in 1929, having dropped 89% from the 1929 peak to the 1932 trough.
144 years ago: 1877 low after the 1873 Panic
The 1873 Panic led to the original Great Depression, in the US and Europe. 1877 marked riots and strikes over pay. A worker’s rebellion in St Louis briefly established a communist government.
233 years ago: 1788 first revolt against French King
This marked the first rising against the French King Louis XVI. The was King was broke, and he declared the Treasury was empty, Parliament refused to raise taxes, and the first revolt took place against the King in June. All of this plus famine and bread riots, lead to the 1789 revolution which rocked Europe for the next couple of decades.
377 years ago: 1644 first defeat for the Royalists
The precursor to 1788, albeit in England. The English King Charles I had an extravagant lifestyle, ran out of money, and wanted to raise taxes to fill the Royal coffers. A civil war ensued. The Royalists are defeated for the first time at Nantwich in 1644. This marked the end of an era, and the beginning of the modern era of Parliamentary democracy.
That’s as far back as I went. Yet it took me back to arguably the most important year from which the modern era evolved, 1644. It is also interesting that as the number sequence took me backwards, the major events are focussed on the pivotal global nations of the time e.g. the US today, England in 1644.
The Implications For Investors
The events on every date are clearly very important in financial and political history – that is spooky.
All of these dates reflect either a historically important high or low, a significant turning point.
If there is a turning point afoot, it is the US which is at the epicentre, especially the tech and growth sectors which have fuelled their market in the last decade.
Most US stock markets peaked in November 2021 e.g. Russell 2000, Wiltshire 5000, NASDAQ Composite. The S&P and Dow Jones peaked, to date, on the third day of January 2022. This slight spill into 2022 does not spoil this analysis – there were so many peaks in 2021, and in 1999/2000, some markets peaked in December 1999, others stretched to March 2000.
The implications of this do not need to cause panic among global investors. In the last teleconference we illustrated a number of occasions when major markets can move in opposite directions for many years (January Teleconference for Gold Members).
Nonetheless, the implication, as a minimum, is that you must not be complacent. In particular do not hang on to last decades obvious winners, particularly the global funds with heavy US and tech holdings. Again this was vividly illustrated in the January Teleconference, particularly showing the rapid and sharp turnaround in recent weeks, as last decades winners turn to losers, and new opportunities emerge.
On Those Patterns…
I would love if someone out there has the maths ability to figure out the odds that such a number sequence would join together these pivotal events in financial and political history. It sure doesn’t feel random!
FURTHER READING
“There is a unique ratio that can be used to describe the proportions of everything from nature's smallest building blocks, such as atoms, to the most advanced patterns in the universe, like the unimaginably large celestial bodies. Nature relies on this innate proportion to maintain balance, but the financial markets also seem to conform to this golden ratio”. (Fibonacci and the Golden Ratio, Investopedia)