 I had promised some more UK-focussed analysis this week, but I am afraid that got pushed to one side as we pored after the reaction of markets to the economic data which has become an even bigger fix for markets than usual. What we know from recent days is that the UK is in recession, which wasn’t a shock, and follows the rest of Europe. The Bank Of England struck a positive tone lest we get too gloomy, telling us that “there are signs of a pickup”. We will return to the UK in coming weeks.
But we do have the latest TopFunds Guide for you, now in its 44th edition, and it's FREE to download here.
Here are some of the highlights of this latest edition:
- Trump and chaos risk
- Asian attractions beyond China
- Hidden opportunity in UK election
- Japan excitement, late but deserved
- Golden opportunities in commodities
- Essential investing habits
- How to select funds for growth
- TopFunds sector by sector
Remember, it is FREE to download here.
I do hope you enjoy it. Myself and the team welcome your feedback.
Back to markets…
Before Christmas, financial markets were dancing to the tune of interest rate cuts sooner and sharper. With the bleary dawn of 2024 the rhythm is more a stagger and a wobble, with bursts of exuberance (in tech) from those on hallucinogenic substances.
Nvidia investors have been smoking something, and the darling of AI now has a market value equal to the whole of the Chinese stock market. In the first 6 weeks of this year its market value increased by $600 billion, which is bigger than the size of each of these economies – Sweden, Belgium, Nigeria, Singapore, Vietnam.
The smartest guys at the party booked a taxi earlier than most. Mark Zuckerberg, boss of Facebook parent Meta, began selling his own shares in November, nearly half a billion dollars worth according to Bloomberg. Amazon’s Jeff Bezos has also sold $4 billion of his shares in the last fortnight, his first sales since 2021.
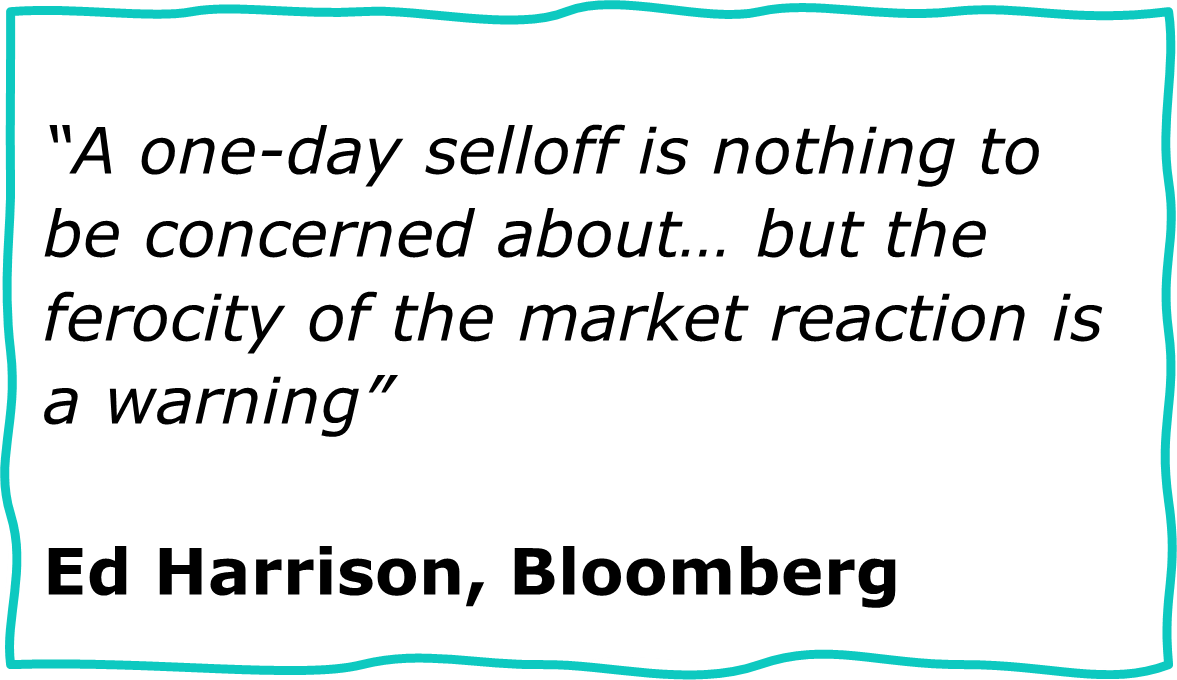
Surprisingly poor, but not terrible, US inflation numbers on Tuesday got markets in a tizzy. Rather than providing answers, they prompted many more questions about the direction of travel. It is not that one month’s data is that important. The vital message is that when markets, US equities and bonds, are priced for perfection, they are extremely vulnerable.
In the 26th January note I mentioned a couple of targets for the S&P 500, being 5087 and 5263. I am adjusting these to 5083 and 5361, based on closing prices for the S&P – if they were based on intra-day peaks and troughs they would be a percent or two higher.
Market trends come in a variety of shapes and sizes, and many of these display similar patterns, and with Elliott Wave Theory these shapes have been categorised. Downtrends have the largest numbers of types, some very complex, and in practice they are somewhat more difficult to identify accurately in real-time – unlike uptrends which have a, relatively, beautiful simplicity most of the time.
As explained in that prior note, the category we see unfolding in the US, the S&P 500, is an irregular flat correction, which has an ABC shape, with the following key points:
|
S&P peak
3rd Jan 2022
|
4796
|
|
Wave A low
13th Oct 2022
|
3577
|
|
Wave A length
|
1,219 points
|
|
Wave B implied length
|
1,506 points (1,219 x 1.236)
|
|
Wave B implied peak
|
5083 (1,506 + 3577)
|
In case you are wondering, the 1.236 is a Fibonacci multiplier (more here for those wishing to get into the long grass).
The highest close so far was last Friday 9th at 5026, 1.1% lower than the 5083 target. The intraday peak was 5048 on Monday 12th.
This US index might hesitate about now, and then plough onwards towards the next target of 5361, 8% above today’s price. There is no certainty on this. Or it could march even higher with a blow-out top in March. Nobody knows with a useful degree of certainty – only those on the aforementioned substances see any certainty.
But we pull together a range of facts and observations which have proved useful in the past, including on investor behaviour. We identify the measurable downside risk, and then try not to fret about missing out on the last few percent of upside – if that is your tendency, behaviourally it makes it somewhat less likely that you will be prepared to apply a stop-loss, and protect those profits, as the market heads determinedly south.
Oh and what about what happens after the wave B peak, wave C? Without getting into the horrible detail, we will have time for that later, the downside targets for the S&P are 3110 and 1891, falls of 39% and 63%. That 63% gets the index down to the area of support which we have been highlighting in recent years.