 Guest blog by Nick Kirrage from The Value Perspective (Schroders).
The Value Perspective (Schroders) keeps on coming out with very insightful pieces and this is another one in a long line highlighting the importance of value (by Nick Kirrage).
At the risk of being accused of overstatement, what follows in a couple of paragraphs is the most important chart in equity investing. Why? Well, looking back over almost a century of UK market data, it seeks to answer a crucial question and that is, in a world where everything keeps changing – politics, economics, thematics and so on – is there anything investors might look to as a constant?
Even what we invest in is ever-changing – back in the 1920s, developments such as the internet would have been regarded as witchcraft – while, as we never tire of pointing out, we cannot know the future. But still, despite all the uncertainty that exists in the world today – in the eurozone, in the Middle East, in China – the following chart asks, is there anything at all we can rely upon? And there is …
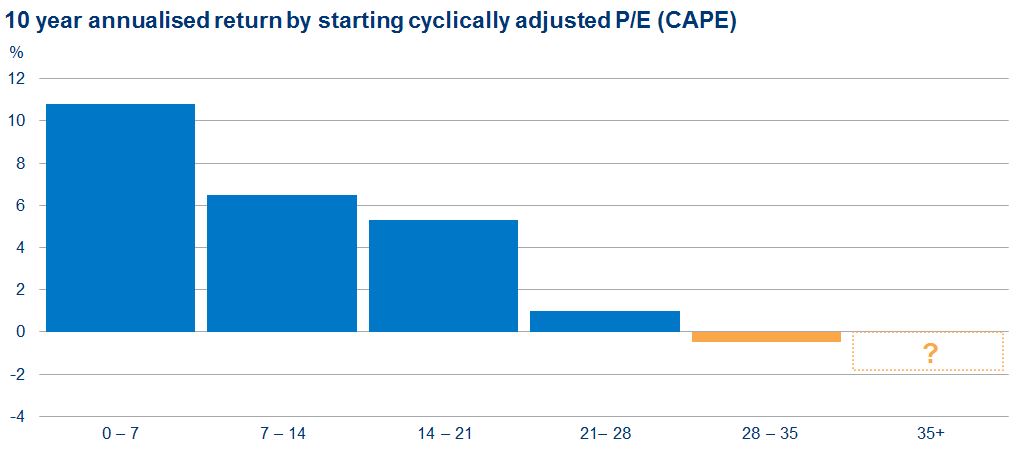
Source: Global Financial Data and Thomson Datastream, as at 30 June 2015
Based on UK Equity market – since 1927
This chart tells equity investors that, whatever factors people may think will determine whether or not they make money, the one thing that will actually determine whether or not they make money – again and again and again – is the price they pay. It looks back over almost 100 years and simply asks, what is the correlation between the price we pay for assets and the returns we later see from them?
To be honest, you could use almost any valuation metric here and see the same result – dividend yields, say, or standard price/earnings (P/E) ratios but, as regular visitors to The Value Perspective will know, we prefer cyclically-adjusted P/E ratios. Standard P/E ratios use forecast profits – also known as ‘guesses’ – while so-called ‘trailing’ P/E ratios use only the most recent year’s profits.
To our minds, however, one year does not offer much of a guide as to whether or not a business has value – and certainly not compared with a decade’s worth of profits numbers divided by 10 to reach a crude but powerful average, which is what cyclically-adjusted P/E ratios give us. Still, as we say, whatever metric you use throws up a perfect correlation.
As you can see, every time the market fell to a P/E ratio of between zero and 7x, you would have made, on average and after inflation, 11% a year, every year for a decade The small print, of course, is every time the market was at those levels, there was something so scary, so apocalyptic, so death-of-equities going on, you would have had to force yourself to buy in but, if you did, you saw a fantastic real return.
Whenever you paid a higher price, however, you would have seen a correspondingly worse return and here is the killer – whatever helped you to justify paying a higher price was irrelevant. Better business? Stronger economic environment? Higher growth? World-changing new technology? It did not matter. What is more, it did not matter even if it turned out you were 100% right about the outcome.
GlaxoSmithKline undoubtedly had high growth 10 years ago. Did you make money in Glaxo? No. The internet undeniably changed our lives forever. Did you make any money in internet stocks? No. The lesson here – and it is an incredibly difficult one for people to hold on to – is, even if you know the future, it will not determine the returns you make. What will, however, is the price you pay.
On The Value Perspective, we struggle to think of any time in the last 15 years when there were more professional investors mistaking great companies for great investments. To illustrate the point, just think of alcoholic drinks giant Diageo. In theory, it has everything you would want from a business – high barriers to entry, world-beating brands, great growth, wonderful cash dynamics and so on.
And yet, the only thing that makes a great company a great investment is a great price and Diageo currently stands at its highest valuation in four decades. To our minds – and if you go by the almost a century of data on which the above chart is built – then, over the next 10 years, buying companies on Diageo’s valuation is going to be a terrible investment.
So what makes our chart so powerful? One thing. Although we said at the start that everything in the world keeps changing, one thing has stayed the same over the last 100 years. Us. Human beings are the constant – markets are cheap when we are fearful; and they are expensive when we are greedy. We are what is underpinning the chart and we are systematically exploitable. Value investing is the system.
Follow the Value Perspective on Twitter