
What triggered the Wall Street Crash is still debated, ditto the 1987 Crash, and that is with the benefit of hindsight. So any analysis of where we are, let alone where we might be heading, has to be with humility and a decent size pinch of salt. Nonetheless, here goes.
Tony fairly asked the question ahead of the last teleconference "what firmed your thinking on the wave 5 roadmap”. Others asked similar questions, and whether the worst was over.
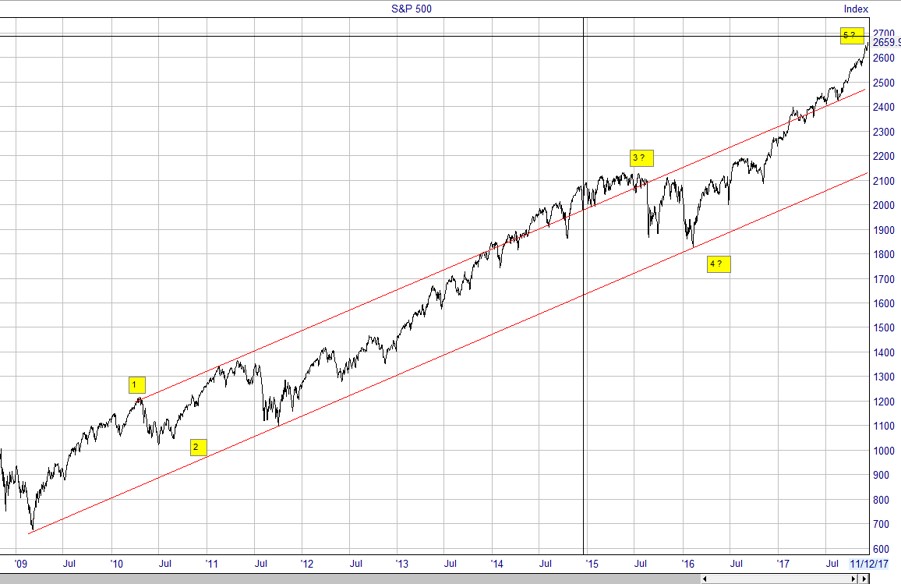
There were two possibilities laid out in the charts in the December teleconference, focussing on the S&P500 index in the US. Looking at the period since the very significant low in March 2009, Chart 1 suggested the whole move (5 waves) was over or very nearly so – the pessimistic case.
Chart 1
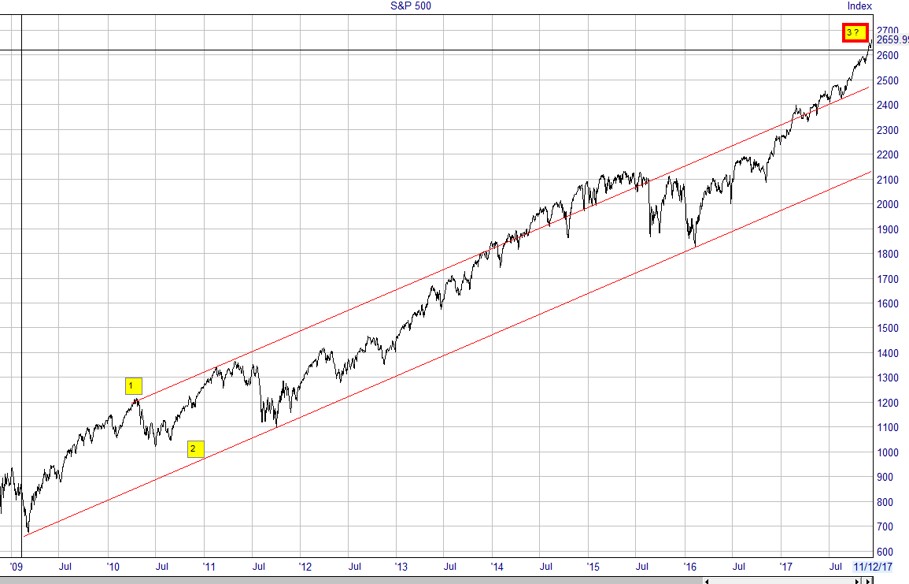
In the alternative, this second chart was based on only wave 3 ending in the near term, with another couple of years to go before the whole move from 2009 ends – the optimistic case.
Chart 2
What was changing even as I was writing that was that the US stock market appeared to be accelerating. Jeremy Grantham at GMO drew attention to this on 3rd January. In addition, back in November 2016, a team at Harvard University noted a common feature of true investment bubbles was an acceleration of the price trend towards the end. My best precedent for this is the UK stock market leading up to the bursting of the tech bubble from December 1999, hence that became the basis of my updated route map in the “Opportunity Knocks or Apocalypse Postponed?” report (OKAP).
The stock market is a behavioural phenomenon – that single number for an index gives us a remarkable insight into how a very large number of people are feeling today, albeit on average. The world driving the underlying businesses of that index, and that of the huge spectrum of investors, is highly complex – it is a world which is very difficult to analyse in a way which generates consistently useful insights for your investing success.
Yet there is one constant. Confidence. Confidence (or lack of it) is the behavioural phenomena which drives markets.
When a stock market accelerates after an uptrend that is already 8 years old, and when that stock market has rarely if ever been as expensive in history, this is very significant.
Earlier this month we received research showing that 5 different sentiment indicators (3) had pushed into new high ground in the US. As they pointed out, sentiment indicators tend to be leading indicators in bull markets – suggesting that the market will rise into even more over-valued territory. Yet another long-in-the-tooth US-based commentator highlighted that confidence and animal spirits amongst corporate execs is growing as they increasingly see Trump as a pro-business President who can make a difference – that is powerful.
What was missing in the comparison with 1997-1999 was the 1998 correction, what I have referred to as a wave 4 in Elliott Wave terms, which assumes 5 waves: 1, 3 & 5 up and 2 & 4 down.
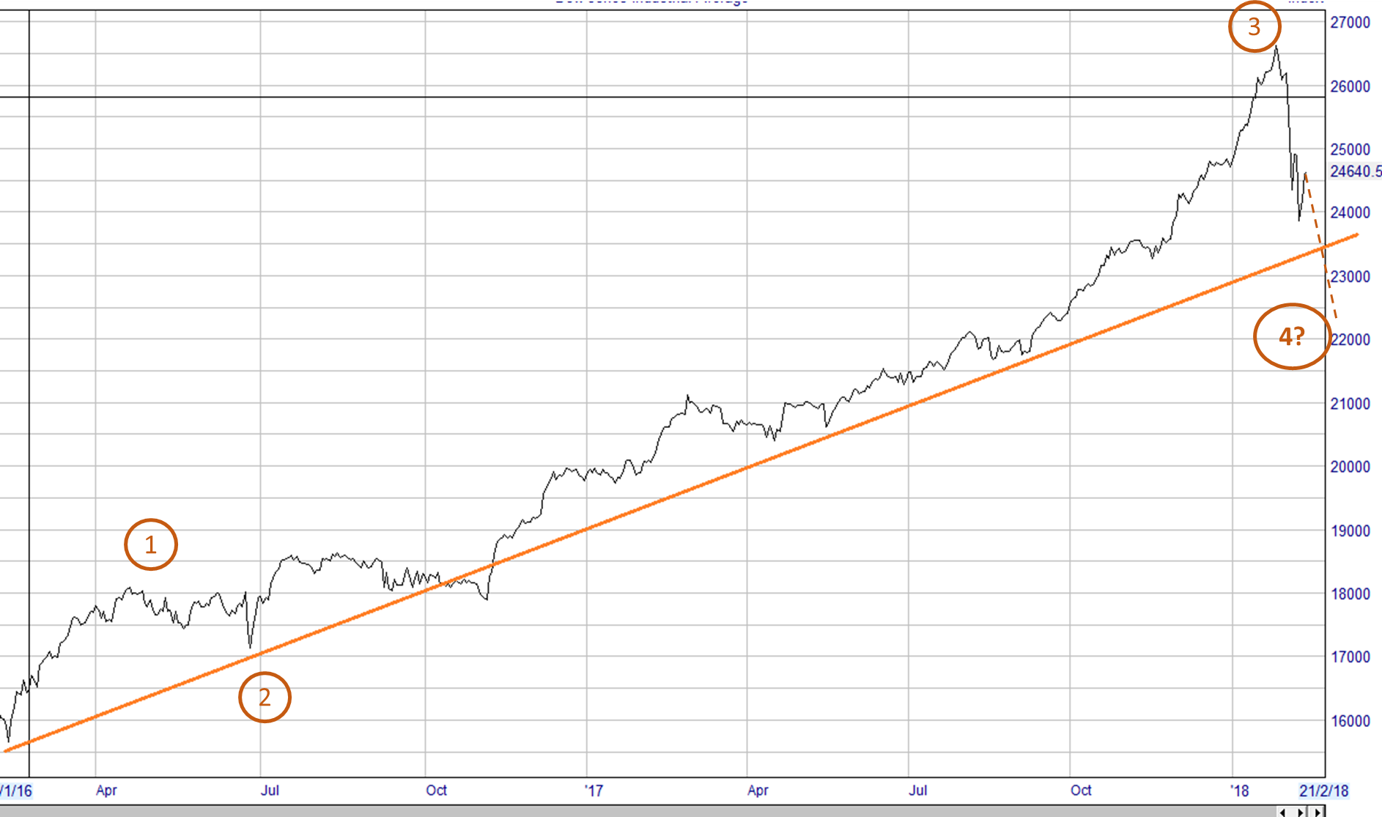
Since the OKAP report there has been a wobble, though not of great substance. If it is over then a more substantial correction lies somewhere in the months ahead, which might be the wave 4 which we await. We don’t think the recent wobble is over, and believe it will end with the US stock market about 14-18% lower than the all-time peak in January. Here is the chart from the teleconference showing this possibility.
Chart 3
We will update this as events unfold.
Last but not least, this is no more than one route map. It builds on the optimistic case put forward before Christmas. But I must not become wedded to this, and be prepared to adjust this route map as events unfold – one of the greatest investor errors is not being able to tear up your own, previously plausible, analysis when events make it clear it is wrong. As George Soros put it:
“I am only rich because I admit my mistakes faster than everybody else”
FURTHER READING
EXTERNAL SOURCES
- “Brace yourself for a possible near-term melt-up”, Jeremy Grantham. GMO, 3rd January 2018.
- “Bubbles for Fama”, Greenwood, Shleifer and You. Harvard University, November 2016
- “The big blow-off before the big blow-out?”, Pring Turner, 2nd February 2018.
- Howard Marks, Oaktree Capital, 23rd January 2018.