
It is important to understand the swings between confidence and panic in markets, and how your approach to investing must be flexible – you must be prepared to change your strategy when the market mood fundamentally changes. This is today's focus.
Panic in the stock market is not really panic at all. It is a perfectly rational response to unfolding events, at heart it is a hard-wired herd instinct. I don’t want to bore everyone with loads this week on behavioural finance (again!), so I will try and keep this short. [What follows is substantially the blog from 14th June 2019, slightly tidied]
I often highlight the behavioural issues or bad habits holding all of us back, but, more positively, [sigh of relief from ever-patient readers] there are three overwhelming behavioural factors which drive markets, and which we must understand and exploit to be successful investors:
- Herding
- Overconfidence
- Overreaction
Herding is a hard-wired, and unconscious, instinct to align ourselves, our feelings and convictions, with those of a group. This is so strong it will overwhelm the more thoughtful conclusions of our conscious brain. Many studies have shown this, but I promised this will be short, so will leave precedents for another occasion.
If you look at a graph of the stock market you are watching the movements of the herd of investors, a herd as compelling as watching the spectacle of the Great Migration snaking across Tanzania and Kenya every year, 1,800 miles and 2 million wildebeest.
Depending on their own background, different market researchers have observed this in different ways over the years. By researchers or analysts, I don’t mean the day to day stuff spat out of the investment industries marketing machinery with tedious regularity. But those who do more ground-breaking or thought-provoking research in scale.
Two are Robert Prechter of Elliott Wave Theory fame, and Elroy Dimson (and his colleagues) who crunch numbers to explore the corners of the investment universe year after year. Two very different people, of that you can be sure. But both recognise the herd of investors in their different ways.
For example, in the paper “108 years of momentum profits” (2008), Dimson Marsh and Staunton explored momentum investing (external link). This was not the first research of its kind for sure. But it is U.K.-based, relatively recent, and more understandable than many prior papers.
[Also, for those who are interested, see link here to “Fact, fiction, and momentum” by Cliff Assness and colleagues in 2014, which handily links to research stretching back decades (external link).]
Elroy (again) recognised the phenomenon of momentum investing, and how rolling over your investments every 6 months into the latest “winners” generated extraordinary extra performance. Before we started our research (focussed on funds) we hadn’t considered this 2008 paper, but after our own results began to emerge we did seek it out, and similar. The reason we did so at that stage is slightly counter-intuitive – let me explain…
Our early findings were so extremely positive in favour of momentum (as now encapsulated in our Dynamic Fund Ratings) that we didn’t believe them. So, we looked for prior research covering this ground, and we found similar results in numerous other sources, including the 2008 paper. This encouraged us to conduct more research and eventually set up FundExpert.
The numbers are absolutely clear. A momentum approach to buying investments works superbly over long periods in terms of extra growth over and above the indices e.g. since 1994/5 the UK All Companies sector Dynamic Portfolio has generated an EXTRA 7.83% per year above the index, on average*. That positive long period is made of small 6-month periods most of which are generating chunky extra performance over the index.
What Elroy and others showed with great clarity is that those performing much better, the winners, have a tendency to carry on doing so. They determined that 6 months was the optimum period i.e. if you look back 6 months and see what is performing best, the winners, they tend to carry on doing so for another 6 months, and then fade.
Herding
If you observe the Great Migration from above you see an extraordinarily long thin line, stretching miles forwards until it disappears over the horizon. If you look more closely you will observe lots of individual wildebeest and zebras zig zagging around that line quite happily. It is the same with the line of the stock market index on any graph - that line hides important detail. Look more closely and you will observe the winning stocks and sectors at any one time – and looking more closely we see that those winners have momentum.
But there is something else about that meandering stock market line on the graph.
The graph shows that most of the time the stock market is going up. This simply reflects the dynamism of human kind - it is what we should expect. But over time that line also has repeating patterns, which are particularly important at times of extremes. This is where Robert Prechter and Elliott Wave Theory come in.
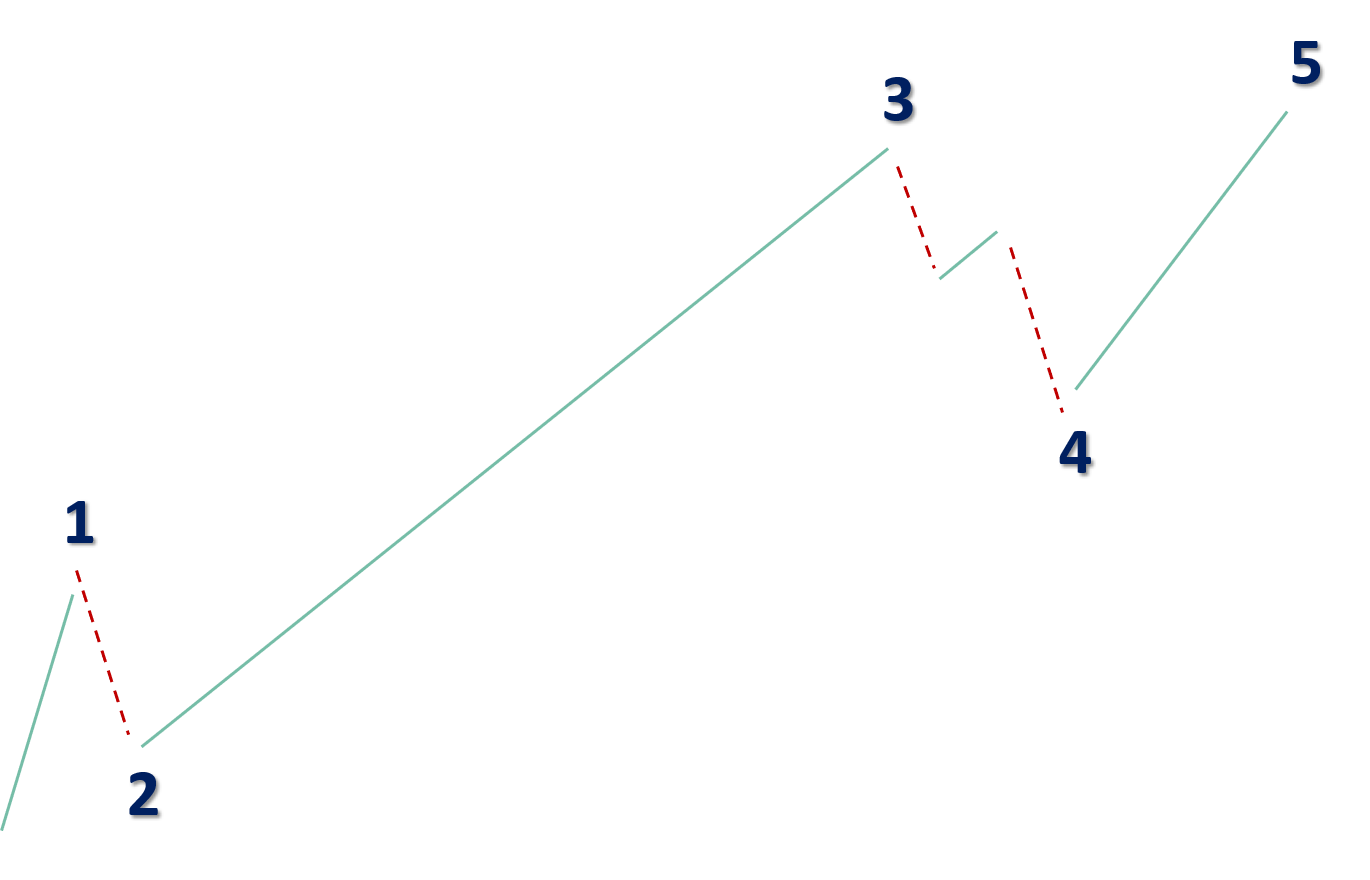
Wave theory has it that an uptrend is made up of 5 waves, 3 waves up and 2 waves down – there is a textbook version of this below. It is the 3rd wave which is typically the longest one, and it is very profitable. It is also at this stage in long term bull markets where momentum investing, using our Dynamic Fund Ratings or otherwise, will work best, generating huge additional profits compared to buying index trackers.
At other times in the stock market cycle, this analysis highlights extremes particularly well, where such extremes can also be confirmed by other indicators, e.g. PE ratios, sentiment indicators, investor behaviour.
In particular it highlights when we are in periods of overconfidence (at or towards a significant peak) and overreaction (around a significant trough), and potential turning points in both instances - not with certainty of course, but at least with a clear rationale - knowing turning points are nearby is very valuable information, putting you on alert, and making sure you are prepared.
For some time now we have been in a period with potential for notable panic in markets. The market valuations (particularly the pivotal US stock market) inform us in this regard, and the Elliott Wave analysis puts this in the context of the longer-term market trend.
In particular, the wave analysis shows that we are in a wave 4-cum-wave 5 stage, making the market panic-prone. Our week-to-week and month-to-month analysis will keep trying to pin this down more precisely, to key turning points - longer standing Gold Members will know we have done this very accurately since early 2018, but this is as much art as science, so we must not get complacent.
From Boom To Gloom – In A Blink
At this stage the stock market can rapidly swing from over-confidence to over-reaction. This is covered off by having a stop-loss and/or higher than usual levels of cash. The period of gloom, the bear market, is a time of great opportunity, and it is worth making a couple of short points about this now, on which we will expand as events unfold, whenever that might be.
When the market panics it is not out of control. It is a rational response to increased uncertainty, at which point a significant volume of the herd of investors will simply mimic the selling of others - because at times of heightened uncertainty this is usually the right thing to do, there is safety in the herd, the herd is moving, therefore “I must move with the herd”.
What YOU must do is be ready to act against the herd. This is not easy. And it gets worse! You have got used to applying Dynamic Fund Ratings, and I bang on about them all the time - and with very good reason, the evidence is overwhelming and compelling. But when the market is down 30-50% the one asset class guaranteed to have momentum is cash!
At this stage you have to do something else.
This is where our “Hidden Value” style of funds come into their own. In particular, it means buying what is beaten up, perhaps what is beaten up most. More on the details another time.
But for now it is worth bearing in mind that in doing so you will be going against your deep-seated instincts. Bizarrely you will probably feel more deeply uncomfortable, and panicky, than those who “panicked”. This is the time of the greatest opportunity.
* I have stuck with the numbers in the original version of this note, 14th June 2019
FURTHER READING