.png) Fancy a straightforward, minimum stress way to identify funds offering growth almost 2x the return of the average UK growth fund? With 97% of funds failing to beat an undemanding benchmark, identifying funds which can achieve such a scale of extra growth has huge attractions for investors.
Fancy a straightforward, minimum stress way to identify funds offering growth almost 2x the return of the average UK growth fund? With 97% of funds failing to beat an undemanding benchmark, identifying funds which can achieve such a scale of extra growth has huge attractions for investors.
In the wake of our latest Vintage Report, here is a deep dive into how the Vintage process works in the two growth-orientated UK stock market sectors – UK All Companies and UK Smaller Companies.
Fund selection could not be simpler than this if you want something better than mediocrity.
To achieve a Vintage rating, a fund must meet two straightforward requirements over the last 10 years:
- The fund must be in the top 40% of performers in its own sector…
- …for 60% of the time
In short, you could say that it means a fund must perform a bit better than average for a bit more than half the time. We do not believe that this is a demanding benchmark.
[The “time” to which we refer is the 120 overlapping 6-monthly periods in the last 10 years, with a higher weighting being given to more recent periods.]
These ratings are reviewed annually. If the new ratings highlight a higher rated fund, you switch into that fund.
The Latest Results – 97% failure rate!
It is worth repeating – that the benchmark for a fund to be Vintage-rated is not demanding.
Yet 97% of funds failed to beat it in our latest research – which is shocking. Nonetheless, it enables us to identify the 3% of funds which were doing rather well, with a high level of consistency.
It is this consistency, revealed by the Vintage ratings, which suggests that the manager of such funds is more skilful than lucky.
No “Mates Rates”!
Our rating systems, Vintage and Dynamic, are objective – not our opinion. Nor are they based on the fund manager paying us (or taking us for nice lunches) for the rating.
It is not fund recommendation by proclamation, "because I'm an expert".
There is no scope for Vintage or Dynamic ratings to be skewed by fund managers with a good story or a big marketing budget.
The Structure
In this blog we apply our Vintage Ratings to the two growth-focussed UK stock market sectors:
- UK All Companies
- UK Smaller Companies
For each sector we create two portfolios.
One is simply the single best fund (“Top 1”, blue graph line), and the second is the best three funds (“Top 3”, green graph line). The performance is from July 2004.
Each portfolio is reviewed annually in July, when the portfolio is changed if there is a new top-rated Vintage fund(s).
In the graphs below you can see these two portfolios compared with the sector average.
Plus, we show you the volatility of these portfolios, by way of the Worst Calendar Month and the Worst Calendar Year for the period from July 2004 to July 2023, and compare these to the sector as a whole. This is the table below each graph.
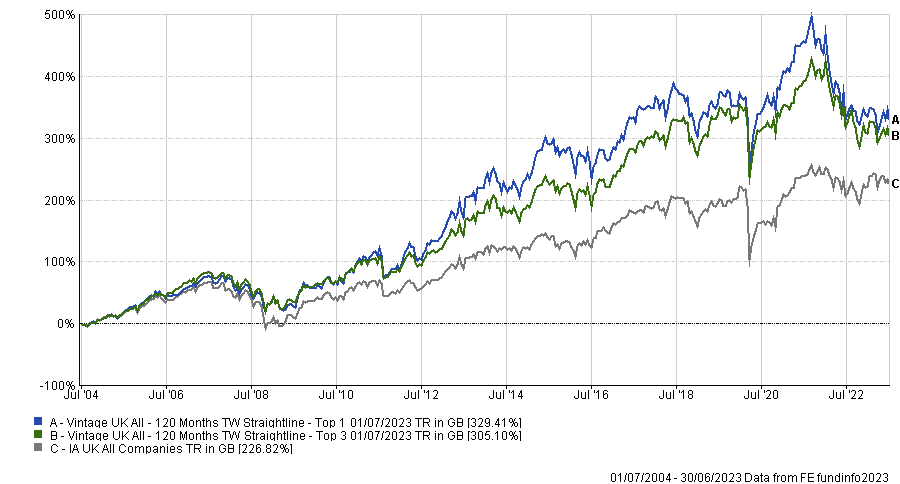
UK All Companies
Both Top 1 and Top 3 portfolios outpaced the sector average, and both did so with less risk.
- The best is the Vintage Top 1 portfolio, up an extra 103% vs the sector average (329% vs 226%).
- Vintage Top 3 portfolio is up 305%.
- If you had invested £100,000 into the Vintage Top 1 portfolio in July 2004 that would have grown to £429,410…
- …that is £102,590 of extra growth compared to the sector average (£429,410 vs £326,820).
- Both portfolios are less volatile than the sector average, on monthly and annual numbers.
- The best-performing Vintage Top 1 portfolio has a Worst Month that’s nearly half the sector average (10.58% vs. 18.43%).
|
|
Total Return %
|
Annualised %
|
Worst Month %
|
Worst Year %
|
|
Vintage UK All – Top 1
|
329
|
9.40
|
-10.58
|
-22.78
|
|
Vintage UK All – Top 3
|
305
|
8.82
|
-10.08
|
-21.40
|
|
UK All Companies Sector Avg
|
226
|
7.44
|
-18.43
|
-31.96
|
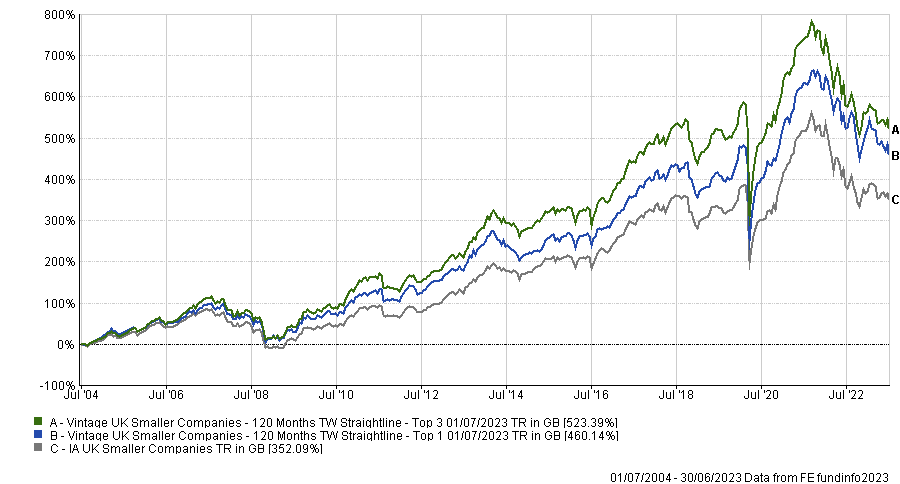
UK Smaller Companies
This is the best of the three UK sectors based on the total return.
Both Top 1 and Top 3 portfolios outperform the sector average, with marginally less risk, in terms of their worst year figures:
- Best is the Vintage Top 3 portfolio, up an extra 171% vs the sector average (523% vs 352%).
- The Vintage Top 1 portfolio is still up an impressive 460%.
- If you had invested £100,000 into the Vintage Top 3 portfolio in July 2004 that would have grown to £623,390…
- …that is £171,300 of extra growth compared to the sector average (£623,390 vs £452,090).
- Both portfolios are less risky (less volatile) than the sector average based on the Worst Year figures.
- The best-performing Vintage Top 3 portfolio has a Worst Year of 36.77% vs. 40.54% for the sector average.
|
|
Total Return %
|
Annualised %
|
Worst Month %
|
Worst Year %
|
|
Vintage UK Smaller – Top 1
|
460
|
11.51
|
-22.10
|
-32.78
|
|
Vintage UK Smaller – Top 3
|
523
|
12.55
|
-22.65
|
-36.77
|
|
UK Smaller Companies Sector Avg
|
352
|
10.88
|
-22.50
|
-40.54
|
Conclusion
Vintage ratings are a great resource for investors that don’t want to review every 3 or 6 months as with Dynamic, and there is relatively limited fund switching required at the July review points each year.
You can see from these numbers that the results are impressive compared to the sector average for these two popular UK growth sectors.
Remember, you should not adopt a “buy-and-forget” approach with these funds (or any of your investments) because inertia is one of the biggest roadblocks to you making the best possible gains.
Make sure that your investment plan clearly includes a review process that you can follow, and that you write down what you bought and, very importantly, why you bought it. This is invaluable if you wish to learn, and notably improve your longer-term investing success.
You can see the full fund details for these two sectors, and all others, in the full Vintage Funds Guide 2023. In addition, use the FundExperts unique tools to identify the Vintage funds, sector by sector, Best Funds by Sector (Vintage) Tool.
Do get in touch with your feedback and let us know what you think; and how you will use Vintage Ratings in your own portfolios.
P.S. And don’t forget basic risk management. That means using our unique Stop-Loss Tool to protect your valuable capital.