As ever, if you have any questions about the below research, please do not hesitate to contact us.
The new funds for each Dynamic Portfolio will be listed below, alternatively you can view the new funds on the designated Portfolio Library page.
Performance graphs will be over a one-year period unless stated otherwise.
The Dynamic Portfolio’s below are sorted A-Z.
Commentary
Just the Dynamic Global Portfolio to review this month (there are 6 in January!).
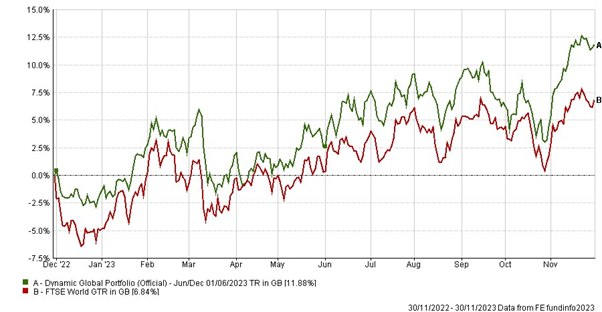
It has been a decent 6 months in general (World Index up 5%), and the Dynamic Global Portfolio has surpassed this, up a little shy of 8%.
Since inception this portfolio is up 948%, which is 2.2x the index. This isn’t a “star” portfolio for us, but that much outperformance remains impressive.
This is an interesting portfolio because it provides automatic global diversification, as you will see on the Portfolio Library page.
The selection for the next 6 months is three obvious quality funds – we just need the markets to allow them to perform! The Nomura Japan fund continues to be held.
- Dynamic Global Portfolio
-
6-Month Review
Dynamic Global Portfolio: up 7.96%
FTSE World Index: up 5.09%
Annual Performance Chart
Performance Table
|
Name
|
6m
|
1yr
|
3yr
|
5yr
|
Since Inception
(Dec 99)
|
|
Dynamic Global Portfolio
|
7.96
|
11.88
|
1.58
|
33.81
|
948.37
|
|
FTSE World Index
|
5.09
|
6.84
|
29.49
|
63.06
|
417.81
|
Risk Table
|
Name
|
Worst Month
|
5 Year Volatility *
|
5-Year Monthly VaR**
|
|
Dynamic Global Portfolio
|
-14.20
|
15.97
|
-7.63
|
|
FTSE World Index
|
-12.52
|
13.69
|
-6.56
|
Review Table
*A measure of the size and frequency of short-term changes in the value of an investment.
**Monthly Value at Risk (VaR). A VaR of 6% means that in 19 months out of 20 you should not, on average, expect a fall in the capital value of more than 6% in any one month. The VaR of a typical UK stock market fund is 6%, for reference.
Performance data as of 01/12/2023