As ever, if you have any questions about the below research please do not hesitate to contact us.
The new funds for each Dynamic Portfolio will be listed below, or alternatively you can view the new funds on the designated Portfolio Library page.
Performance Graphs will be over their review period unless stated otherwise.
The Dynamic Portfolio’s below are sorted A-Z.
Commentary
There are three Dynamic Portfolios up for review this month:
· Dynamic Japan 3-Month Portfolio
· Dynamic UK Blended Portfolio
· Dynamic World ex-UK Portfolio
Dynamic Japan 3-Month Portfolio
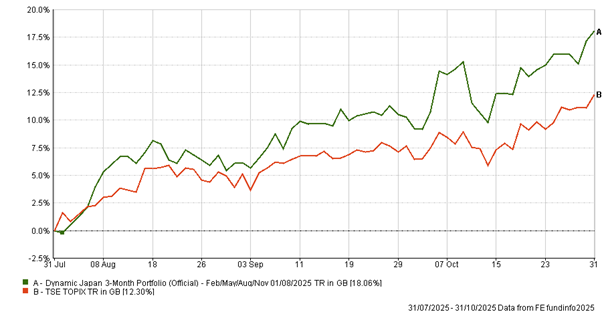
A superb 3 months for Japan, with the dynamic portfolio up 18.06% vs the TOPIX up 12.3%. Value based funds had an excellent run and the portfolio switches into another value-focused holding, M&G Japan.
· Since inception (Feb ’00) +565.88% vs TSE TOPIX +156.90%
Dynamic UK Blended Portfolio
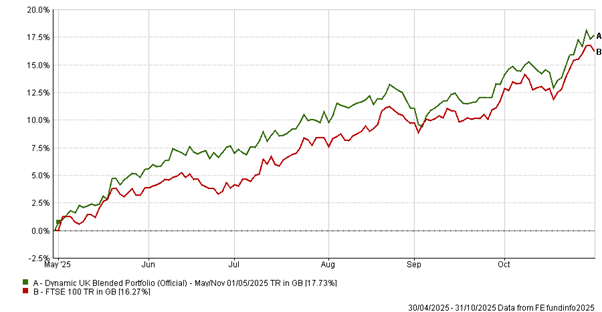
A strong 6 months for the UK too, with this portfolio up 17.73% vs the FTSE 100 up 16.27%. The UK has been quietly outperforming year to date, even beating the S&P 500 so far.
All three funds change for the next period and much like Japan, reflects the strength of value investing in the current environment.
· Since inception (May ’00) +1,994.65% vs FTSE 100 +283.94%
Dynamic World ex-UK Portfolio
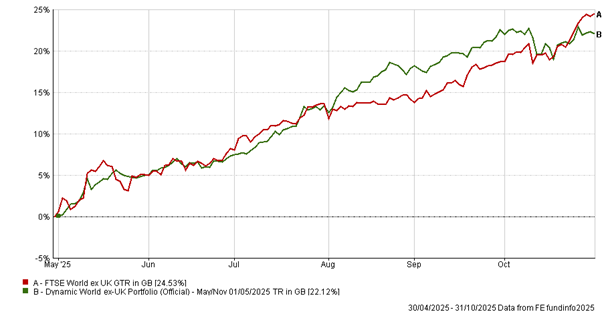
This portfolio was up 22.12% in six months, just behind the FTSE World ex UK up 24.53%. US tech and AI-linked sectors once again led the way, while Asia and Emerging Markets also contributed.
All three funds change, with two being US focused and one into Asia.
· Since inception (May ’00) +1,144.36% vs FTSE World ex UK +620.58%
- Dynamic Japan 3-Month Portfolio
3-Month Review
Dynamic Japan 3-Month Portfolio: up 18.06%
TSE TOPIX: up 12.30%
Review Period Performance Chart
Performance Table
| Name | 3m | 6m | 1yr | 3yr | 5yr | Since Inception (Feb 00) |
|---|
| Dynamic Japan 3-Month Portfolio | 18.06 | 31.76 | 28.82 | 52.40 | 56.66 | 565.88 |
| TSE TOPIX | 12.30 | 17.54 | 20.89 | 53.79 | 54.47 | 156.90 |
Risk Table
| Name | 5 Year Volatility * | 5-Year Monthly VaR** |
|---|
| Dynamic Japan 3-Month Portfolio | 13.99 | -8.42 |
| TSE TOPIX | 10.28 | -6.89 |
Review Table
| Old fund | New fund |
|---|
| Nomura Japan Strategic Value | M&G Japan |
- Dynamic UK Blended Portfolio
6-Month Performance
Dynamic UK Blended Portfolio: up 17.73%
FTSE 100 Index: up 16.27%
Review Period Performance Chart
Performance Table
| Name | 6m | 1yr | 3yr | 5yr | Since Inception (May 00) |
|---|
| Dynamic UK Blended Portfolio | 17.73 | 13.71 | 44.73 | 72.56 | 1,994.65 |
| FTSE 100 Index | 16.27 | 24.14 | 53.08 | 109.37 | 283.94 |
Risk Table
| Name | 5 Year Volatility * | 5-Year Monthly VaR** |
|---|
| Dynamic UK Blended Portfolio | 12.43 | -5.82 |
| FTSE 100 Index | 10.71 | -5.06 |
Review Table
- Dynamic World ex UK Portfolio
6-Month Performance
Dynamic World ex UK Portfolio: up 22.12%
FTSE World ex UK Index: up 24.53%
Review Period Performance Chart
Performance Table
| Name | 6m | 1yr | 3yr | 5yr | Since Inception (May 00) |
|---|
| Dynamic World ex UK Portfolio | 22.12 | 19.10 | 49.14 | 41.36 | 1,144.36 |
| FTSE World ex UK Index | 24.53 | 20.87 | 61.44 | 106.94 | 620.58 |
Risk Table
| Name | 5 Year Volatility * | 5-Year Monthly VaR** |
|---|
| Dynamic World ex UK Portfolio | 13.99 | -7.34 |
| FTSE World ex UK Index | 11.88 | -5.55 |
Review Table
Performance data as of 31/10/2025
*A measure of the size and frequency of short term changes in the value of an investment.
**Monthly Value at Risk (VaR). A VaR of 6% means that in 19 months out of 20 you should not, on average, expect a fall in the capital value of more than 6% in any one month. The VaR of a typical UK stock market fund is 6%, for reference.