Yes, party like it’s 1999. This week all those years ago we were all listening to Britney Spears - a momentous year.
If 1999 is a bit hazy, don’t worry, because the US stock market is serving it up one more time, but bigger and better.
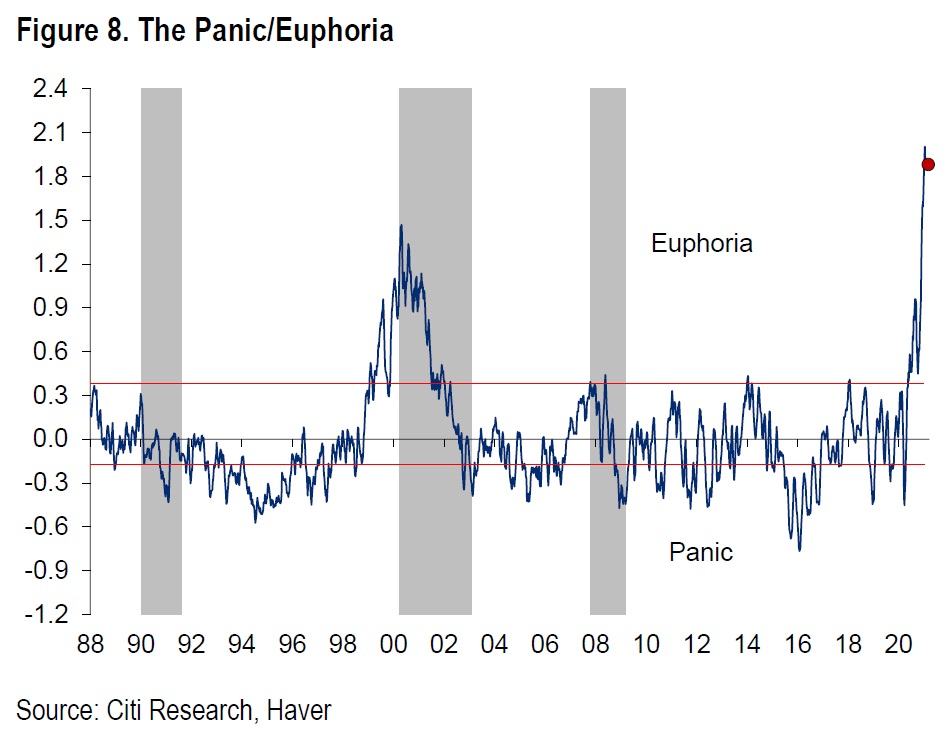
Below is a chart of Citigroup’s Euphoria index, which is now way higher than in 1999/2000. Remember, the bubble of 1999 was said to be the most extreme in 300 years.
There are many examples of the US stock market mania, and this is one of the best.
For those of you that like to look under the bonnet, it is made up of:
“NYSE short interest ratio, margin debt, Nasdaq daily volume as a percentage of NYSE volume, a composite average of Investors Intelligence and the American Association of Individual Investors bullishness data, retail money funds, the put/call ratio, the CRB futures index, gasoline prices, and the ratio of price premiums in puts versus calls” says John Authers, for which thank you.