In our monthly Dynamic Portfolio review we provide some background commentary and insights, as well as performance tables & graphs, risk tables, and where to go to find the new funds for each Dynamic Portfolio.
As ever, if you have any questions about the below research please do not hesitate to contact us.
The new funds for each Dynamic Portfolio will be listed below, or alternatively you can view the new funds on the designated Portfolio Library page.
Performance Graphs will be over a one-year period unless stated otherwise.
The Dynamic Portfolio’s below are sorted A-Z.
Commentary
There are two portfolios being updated this month, Bonkers 6-Months and Dynamic Asia & EM Portfolio. They both had a storming 6 months, Bonkers up 21.96% and Asia an even more impressive 25.25% of growth.
Starting with Bonkers, with the advance of AI having dominated the financial media in the last 6 months, it will be no surprise that the tech fund selection for the last 6 months has performed particularly strongly.
It is 6 monthly performances like this which have driven the long-term performance, the portfolio being up 19,800% since September 1995, which is more than 18x the World index.
For the 6 months ahead another tech fund is showing.
Turning to Dynamic Asia & EM, taken as a whole Asia has not been exciting for some time, with China being poor, and holding back much of the region. But India and Japan have shone through and the structure of this portfolio honed in on those opportunities, up more than 25% in the last 6 months.
Since launch in 1999 this portfolio is up a meaty 6,873%, which is also more than 18x the index.
- Bonkers 6-Month Portfolio
-
6-Month Review
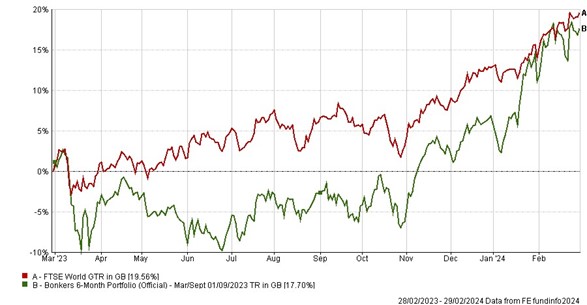
Bonkers 6-Month Portfolio: up 21.96%
FTSE World: up 11.78%
Annual Performance Chart
Performance Table
|
Name
|
6m
|
1yr
|
3yr
|
5yr
|
Since Inception
(Sep 95)
|
|
Bonkers 6-Month Portfolio
|
21.96
|
17.70
|
27.77
|
245.57
|
19800.94
|
|
FTSE World
|
11.78
|
19.56
|
40.92
|
82.83
|
1028.57
|
Risk Table
|
Name
|
Worst Month
|
5 Year Volatility *
|
5-Year Monthly VaR**
|
|
Bonkers 6-Month Portfolio
|
-19.85
|
23.34
|
-10.37
|
|
FTSE World
|
-15.99
|
13.31
|
-5.53
|
Review Table
- Dynamic Asia & EM Portfolio
-
6-Month Performance
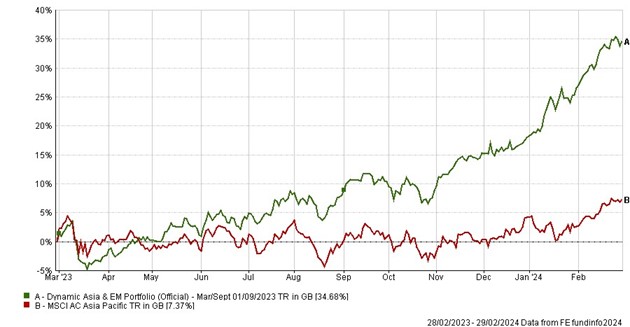
Dynamic Asia & EM Portfolio: up 25.25%
MSCI Asia Pacific: up 7.82%
Annual Performance Chart
Performance Table
|
Name
|
6m
|
1yr
|
3yr
|
5yr
|
Since Inception
(Mar 99)
|
|
Dynamic Asia & EM Portfolio
|
25.25
|
34.68
|
17.61
|
84.86
|
6873.62
|
|
MSCI Asia Pacific
|
7.82
|
7.37
|
-0.72
|
28.85
|
366.50
|
Risk
|
Name
|
Worst Month
|
5 Year Volatility *
|
5-Year Monthly VaR**
|
|
Dynamic Asia & EM Portfolio
|
-18.67
|
15.36
|
-5.95
|
|
MSCI Asia Pacific
|
-12.41
|
12.46
|
-7.00
|
Review
*A measure of the size and frequency of short-term changes in the value of an investment.
**Monthly Value at Risk (VaR). A VaR of 6% means that in 19 months out of 20 you should not, on average, expect a fall in the capital value of more than 6% in any one month. The VaR of a typical UK stock market fund is 6%, for reference.
Performance data as of 29/02/2024