As ever, if you have any questions about the below research please do not hesitate to contact us.
The new funds for each Dynamic Portfolio will be listed below, or alternatively you can view the new funds on the designated Portfolio Library page.
Performance Graphs will be over the review period unless stated otherwise.
The Dynamic Portfolio’s below are sorted A-Z.
Commentary
There are 6 Dynamic Portfolios to update this month.
- Bonkers 3-Month Portfolio
- Bonkers 6-Month Portfolio
- Dynamic Asia (Including ITs) Portfolio
- Dynamic Cautious Portfolio
- Dynamic Commodities Portfolio
- Dynamic UK All Companies Portfolio
Bonkers 3-Month Portfolio
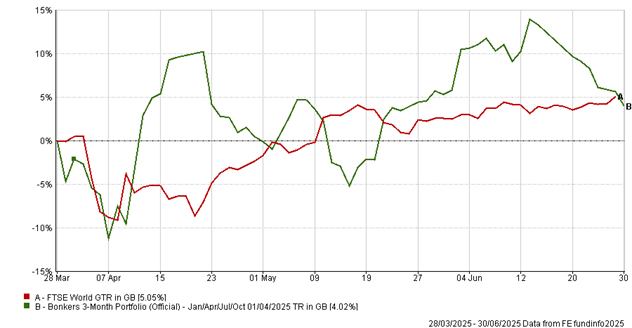
A decent rebound after a tough start following Tariff Liberation Day. Out goes gold and in comes Barings Korea Trust riding the momentum in Korean equities.
- Since inception: +4,445% vs FTSE World +633%
Bonkers 6-Month Portfolio
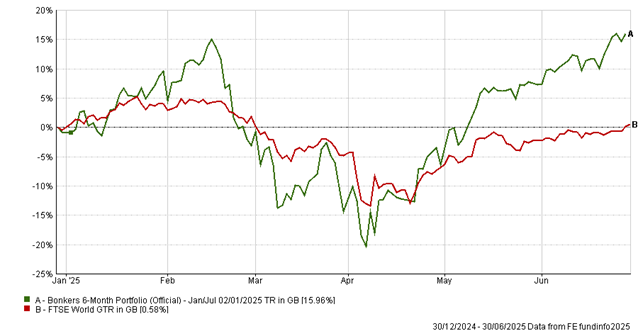
A huge outperformance this cycle, ending the period up nearly 16% having been down around 20% at the start of April. US growth is out and this portfolio moves to Jupiter Gold and Silver as the miners had a storming 6 months.
- Since inception: +18,143% vs FTSE World +1,353%
Dynamic Asia (Including ITs) Portfolio
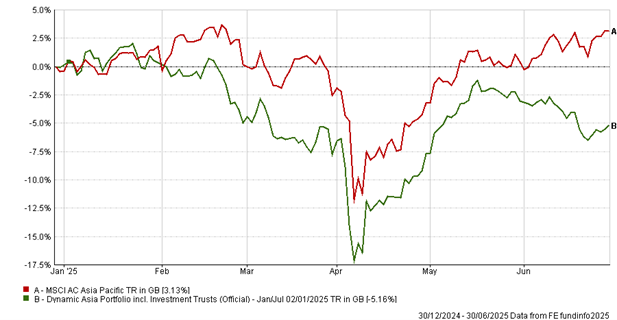
A tricky 6 months for this portfolio as the South East Asian Nations struggled against other Asian peers. This portfolio shifts from Barings ASEAN into Man GLG Asia (ex-Japan).
- Since inception: +2,896% vs MSCI Asia +225%
Dynamic Cautious Portfolio
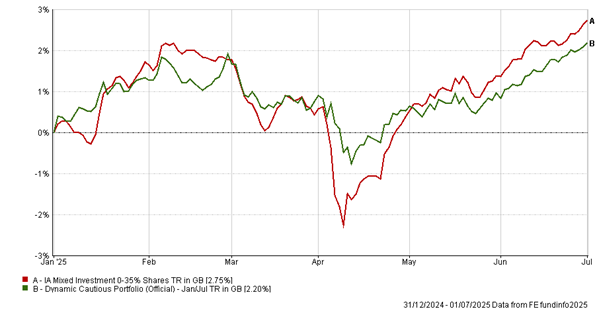
Slightly behind the benchmark this cycle but you’ll notice over the tariff chaos at the start of April, this portfolio went down around 1% which was less than half the benchmark. All 5 funds are switched out for the next period.
- Since inception: +242% vs sector +136%
Dynamic Commodities Portfolio
Awaiting Data
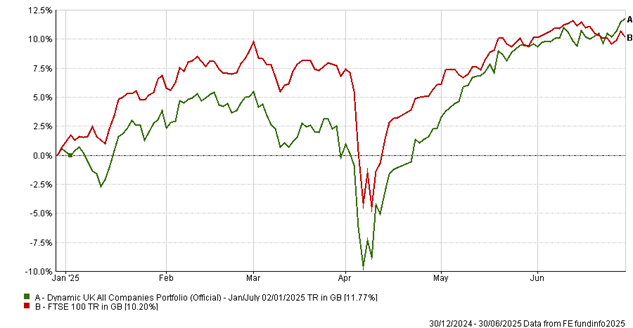
Dynamic UK All Companies Portfolio
One of the strongest relative performers. We’re seeing life return to the UK market and two of the funds stay in for the next cycle.
- Since inception: +3,048% vs FTSE 100 +804%
- Accordion title 1
-
Accordion
3-Month Review
Bonkers 3-Month Portfolio: up 4.02%
FTSE World Index: up 5.05%
Review Period Performance Chart
Performance Table
|
Name
|
3m
|
6m
|
1yr
|
3yr
|
5yr
|
Since Inception
(Oct 99)
|
|
Bonkers 3-Month Portfolio
|
4.02
|
-5.31
|
-8.93
|
-4.35
|
-3.68
|
4445.46
|
|
FTSE World Index
|
5.05
|
0.10
|
7.26
|
47.35
|
79.65
|
633.00
|
Risk Table
|
Name
|
Worst Month
|
5 Year Volatility *
|
5-Year Monthly VaR**
|
|
Bonkers 3-Month Portfolio
|
-.25.97
|
23.20
|
-13.96
|
|
FTSE World Index
|
-12.52
|
11.66
|
-5.65
|
Review Table
- Bonkers 6-Month Portfolio – Jan-Jul
-
6-Month Performance
Bonkers 6-Months Portfolio: up 15.96%
FTSE World Index: up 0.58%
Review Period Performance Chart
Performance Table
|
Name
|
6m
|
1yr
|
3yr
|
5yr
|
Since Inception
(Jan 95)
|
|
Bonkers 6-Month Portfolio - Jan-Jul
|
15.96
|
24.07
|
62.66
|
86.01
|
18143.07
|
|
FTSE World Index
|
0.58
|
7.26
|
47.35
|
79.65
|
1353.31
|
Risk
|
Name
|
Worst Month
|
5 Year Volatility *
|
5-Year Monthly VaR**
|
|
Bonkers 6-Month Portfolio - Jan-Jul
|
-29.20
|
22.91
|
-11.48
|
|
FTSE World Index
|
-15.99
|
11.67
|
-5.64
|
Review
- Dynamic Asia (including ITs)
-
6-Month Performance
Dynamic Asia (including ITs) Portfolio: down 5.16%
MSCI Asia Pacific Index: up 3.13%
Review Period Performance Chart
Performance Table
|
Name
|
6m
|
1yr
|
3yr
|
5yr
|
Since Inception
(Jan 00)
|
|
Dynamic Asia (including ITs)
|
-5.16
|
-1.14
|
15.42
|
103.08
|
2895.73
|
|
MSCI Asia Pacific Index
|
3.13
|
6.28
|
22.50
|
30.19
|
224.73
|
Risk
|
Name
|
Worst Month
|
5 Year Volatility *
|
5-Year Monthly VaR**
|
|
Dynamic Asia (including ITs)
|
-16.30
|
16.80
|
-7.21
|
|
MSCI Asia Pacific Index
|
-12.41
|
10.94
|
-6.93
|
Review
- Dynamic Cautious Portfolio
-
6-Month Performance
Dynamic Cautious Portfolio: up 2.20%
(UT) Mixed Investment 0-35% Shares Sector Average: up 2.75%
Review Period Performance Chart
Performance Table
|
Name
|
6m
|
1yr
|
3yr
|
5yr
|
Since Inception
(Jan 00)
|
|
Dynamic Cautious Portfolio
|
2.20
|
6.76
|
14.24
|
-0.23
|
241.66
|
|
(UT) Mixed Investment 0-35% Shares Sector Average
|
2.75
|
4.94
|
11.95
|
9.39
|
135.76
|
Risk
|
Name
|
Worst Month
|
5 Year Volatility *
|
5-Year Monthly VaR**
|
|
Dynamic Cautious Portfolio
|
-9.56
|
6.59
|
-3.48
|
|
(UT) Mixed Investment 0-35% Shares
Sector Average
|
-7.09
|
5.30
|
-1.80
|
Review
- Dynamic Commodities Portfolio
-
Awaiting Data
- Dynamic UK All Companies Portfolio
-
6-Month Performance
Dynamic UK All Companies Portfolio: up 11.77%
FTSE 100 Index: up 10.20%
Review Period Performance Chart
Performance Table
|
Name
|
6m
|
1yr
|
3yr
|
5yr
|
Since Inception
(Jul 94)
|
|
Dynamic UK All Companies Portfolio
|
11.77
|
20.76
|
50.99
|
97.50
|
3047.58
|
|
FTSE 100 Index
|
10.20
|
11.30
|
37.02
|
71.01
|
803.87
|
Risk
|
Name
|
Worst Month
|
5 Year Volatility *
|
5-Year Monthly VaR**
|
|
Dynamic UK All Companies Portfolio
|
-24.72
|
12.15
|
-5.54
|
|
FTSE 100 Index
|
-13.41
|
11.18
|
-5.22
|
Review