In our monthly Dynamic Portfolio review we provide some background commentary and insights, as well as performance tables and graphs, risk tables, and where to go to find the new funds for each Dynamic Portfolio.
The new funds for each Dynamic Portfolio are listed below. Alternatively you can view the new funds on the designated Portfolio Library page – importantly, by following this link, you will also see how each portfolio is built.
Performance graphs below are over a one-year period unless stated otherwise.
The Dynamic Portfolio’s below are sorted A-Z.
Commentary
A lot of Dynamic Portfolios to update this month.
Over the last 6 months Brazil and India stand out amongst major indices, but it is the dominance of the US indices, up from 5-8%, which has in turn driven the FTSE All-World index, up 4.5%. Only just behind, up 4.4%, is the FTSE 250 index, that is the UK stock markets medium-sized companies.
Here are todays portfolios for update:
- Bonkers 3-Month Portfolio
- Bonkers 6-Month Portfolio
- Dynamic Asia (Including ITs) Porfolio
- Dynamic Cautious Portfolio
- Dynamic Commodities Portfolio
- Dynamic UK All Companies Portfolio
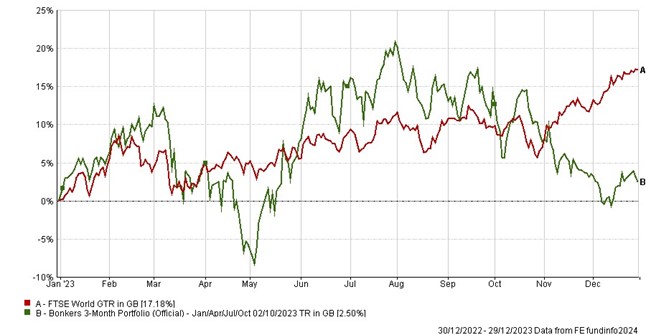
The Bonkers 3-Month Portfolio had a shocker, down 10% versus up 6% from the World index. Switching now from Energy to ARK Disruptive Innovation feels truly bonkers. But this has always been more about fun!
Nonetheless, for those with strong stomachs the long-term return is 4,920% versus 507% for the index. That’s a return nearly 10x that of the index.
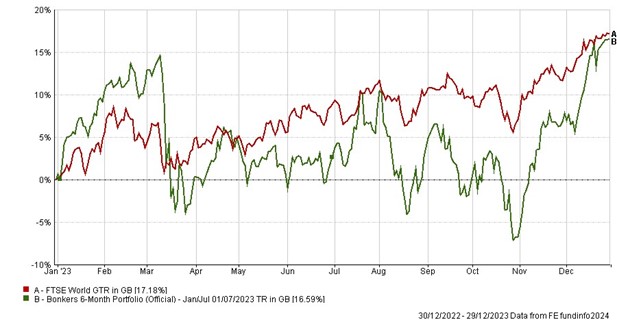
The Bonkers 6-Month Portfolio has performed much more sensibly, at least relatively. Global Tech took the portfolio up 13% compared to 6% for the World index. The switch is to European Property equities.
Since inception it is up 14,906% versus 1098% for the index, growth of nearly 14x the index. Not bad.
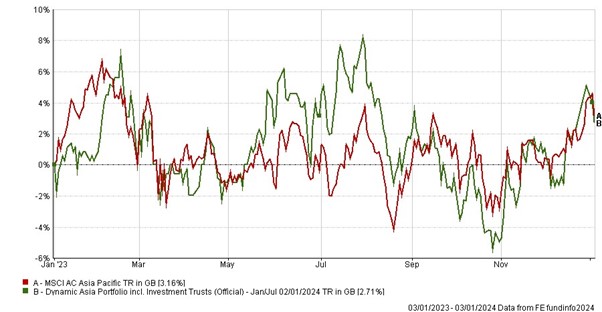
Dynamic Asia including ITs has had a lackluster 6 months. In fact, in the Asian chart below, you can see that Asia has had a lackluster year. The Asian portfolio is down 1.8% and the index up 1.8%, and this differential has swung around over short periods.
It feels wrong to ignore Asia in 2024 with so many risks swirling in the West. The switch into an Asian small cap fund feels right if Asian markets are to find their feet in 2024.
This is one of our favourite portfolios in the long term. Growth is 2,602% from inception versus 181% for the index, that is 14x better than the index.
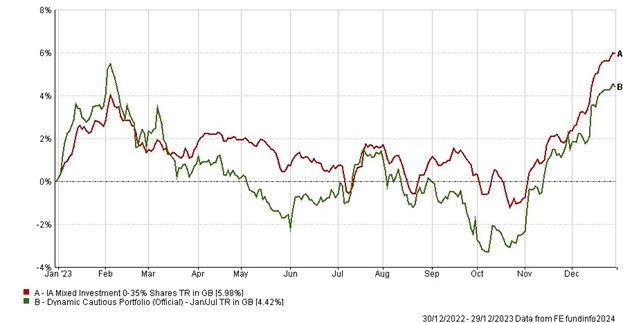
Turning to the Dynamic Cautious Portfolio, we have been highlighting the problems with supposedly low risk sectors and asset classes for a number of years. So far the heat has been on US and UK government bonds, down around 50% at worst. Other low risk sectors, particularly corporate bonds and property remain exposed, with obvious cracks in commercial property values across Western economies in the last 12 months. As such, for some years we have said we are not happy with typically low risk sectors, or the Dynamic Cautious Portfolio which typically draws from these sectors.
This Cautious Portfolio and its benchmark are both up over 5% in the last 6 months, but this area still carries too much risk for most investors who classify themselves as “cautious”.
The long-term performance is 1.7x the benchmark.
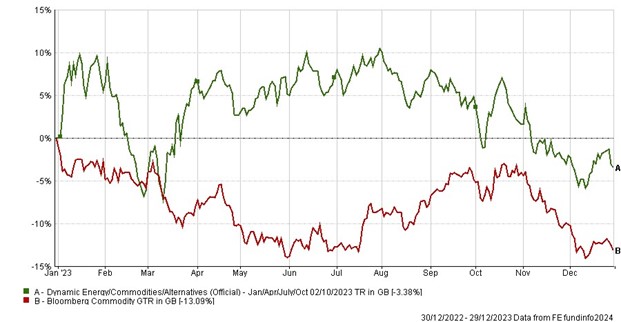
The Dynamic Commodities Portfolio is of much greater interest, though overtly more risky. Energy had a very volatile 3 months, and this portfolio and the benchmark both fell by 7-8%.
The selection for the next 3 months includes two gold funds. Gold has proven to be a much less volatile asset class for the last year, and the gold price also appears to be on the verge of breaking upwards.
Since inception this portfolio has generated growth of 36x the benchmark – even better than Bonkers!
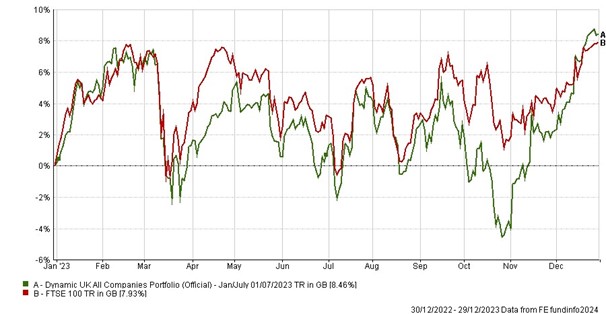
Last but not least Dynamic UK All Companies. Focussed on just one fund sector, and only unit trusts, it was the basis of much of our original research, with a track record stretching back to July 1994.
Since 1994 it has grown by 2,355%, which is 3.6x the FTSE 100 index, with income reinvested.
Over the last 6 months this Dynamic Portfolio is up 7.7% versus 4.5% for the index. Only two of the funds change for the 6 months ahead, with the funds as a whole having a bit more of a Value-style bias.
Do note from the annual graph for this portfolio that the UK market has gone sideways in a range for the last 12 months, and currently sits at the top of that range.
- Bonkers 3-Month Portfolio
-
3-Month Review
Bonkers 3-Month Portfolio: down 10.37%
FTSE World: up 6.89%
Annual Performance Chart
Performance Table
|
Name
|
3m
|
6m
|
1yr
|
3yr
|
5yr
|
Since Inception
(Oct 99)
|
|
Bonkers 3-Month Portfolio
|
-10.37
|
-10.88
|
2.50
|
-19.63
|
-5.49
|
4920.12
|
|
FTSE World
|
6.89
|
7.62
|
17.18
|
32.80
|
83.87
|
507.42
|
Risk Table
|
Name
|
Worst Month
|
5 Year Volatility *
|
5-Year Monthly VaR**
|
|
Bonkers 3-Month Portfolio
|
-25.97
|
24.07
|
-13.21
|
|
FTSE World
|
-12.52
|
13.29
|
-5.99
|
Review Table
- Bonkers 6-Month Portfolio
-
6-Month Review
Bonkers 6-Month Portfolio: up 13.57%
FTSE World: up 7.62%
Annual Performance Chart
Performance Table
|
Name
|
6m
|
1yr
|
3yr
|
5yr
|
Since Inception
(Jan 95)
|
|
Bonkers 6-Month Portfolio
|
13.57
|
16.59
|
39.16
|
114.39
|
14906.07
|
|
FTSE World
|
7.62
|
17.18
|
32.80
|
83.87
|
1098.55
|
Risk Table
|
Name
|
Worst Month
|
5 Year Volatility *
|
5-Year Monthly VaR**
|
|
Bonkers 6-Month Portfolio
|
-29.20
|
25.68
|
-12.79
|
|
FTSE World
|
-16.00
|
13.29
|
-5.99
|
Review Table
- Dynamic Asia (Including ITs) Portfolio
-
Dynamic Asia (Inc.ITs) Portfolio: down 1.82%
MSCI Asia Pacific Index: up 1.82%
Annual Performance Chart
Performance Table
|
Name
|
6m
|
1yr
|
3yr
|
5yr
|
Since Inception
(Jan 00)
|
|
Dynamic Asia (Inc. ITs) Portfolio
|
-1.82
|
2.71
|
18.94
|
140.72
|
2614.86
|
|
MSCI Asia Pacific Index
|
1.82
|
3.16
|
-3.62
|
28.01
|
178.03
|
Risk Table
|
Name
|
Worst Month
|
5 Year Volatility *
|
5-Year Monthly VaR**
|
|
Dynamic Asia (Inc. ITs) Portfolio
|
-16.30
|
18.28
|
-8.94
|
|
FTSE World
|
-12.41
|
12.35
|
-7.63
|
Review Table
- Dynamic Cautious Portfolio
-
6-Month Review
Dynamic Cautious Portfolio: up 5.21%
UT Mixed Investment 0-35% Share Sector Average: up 5.35%
Annual Performance Chart
Performance Table
|
Name
|
6m
|
1yr
|
3yr
|
5yr
|
Since Inception
(Jan 00)
|
|
Dynamic Cautious Portfolio
|
5.21
|
4.42
|
-10.67
|
-7.48
|
208.53
|
|
UT Mixed Investment 0-35%
Share Sector Average
|
5.35
|
5.98
|
-2.86
|
9.71
|
119.77
|
Risk Table
|
Name
|
Worst Month
|
5 Year Volatility *
|
5-Year Monthly VaR**
|
|
Dynamic Cautious Portfolio
|
-9.56
|
8.45
|
-4.21
|
|
UT Mixed Investment 0-35%
Share Sector Average
|
-7.09
|
6.48
|
-1.96
|
Review Table
- Dynamic Commodities Portfolio
-
3-Month Review
Dynamic Commodities Portfolio: down 7.80%
Bloomberg Commodity: down 8.66%
Annual Performance Chart
Performance Table
|
Name
|
3m
|
6m
|
1yr
|
3yr
|
5yr
|
Since Inception
(Jan 09)
|
|
Dynamic Commodities Portfolio
|
-7.80
|
-9.81
|
-3.38
|
45.60
|
121.02
|
319.55
|
|
Bloomberg Commodities
|
-8.66
|
-0.36
|
-13.09
|
45.70
|
41.80
|
8.76
|
Risk Table
|
Name
|
Worst Month
|
5 Year Volatility *
|
5-Year Monthly VaR**
|
|
Dynamic Commodities Portfolio
|
-14.59
|
21.72
|
-8.75
|
|
Bloomberg Commodities
|
-10.88
|
14.46
|
-7.57
|
Review Table
- Dynamic UK All Companies Portfolio
-
6-Month Review
Dynamic UK All Companies: up 7.70%
FTSE 100: up 4.55%
Annual Performance Chart
Performance Table
|
Name
|
6m
|
1yr
|
3yr
|
5yr
|
Since Inception
(Jul 94)
|
|
Dynamic UK All Companies Portfolio
|
7.70
|
8.46
|
36.10
|
53.43
|
2355.46
|
|
FTSE 100
|
4.55
|
7.93
|
33.85
|
38.90
|
652.77
|
Risk Table
|
Name
|
Worst Month
|
5 Year Volatility *
|
5-Year Monthly VaR**
|
|
Dynamic UK All Companies Portfolio
|
-24.72
|
18.13
|
-8.02
|
|
FTSE 100
|
-13.41
|
13.75
|
-7.80
|
Review Table
*A measure of the size and frequency of short-term changes in the value of an investment.
**Monthly Value at Risk (VaR). A VaR of 6% means that in 19 months out of 20 you should not, on average, expect a fall in the capital value of more than 6% in any one month. The VaR of a typical UK stock market fund is 6%, for reference.
Performance data as of 31/12/2023