As ever, if you have any questions about the below research please do not hesitate to contact us.
The new funds for each Dynamic Portfolio will be listed below, or alternatively you can view the new funds on the designated Portfolio Library page.
Performance Graphs will be over the review period unless stated otherwise.
The Dynamic Portfolio’s below are sorted A-Z.
Commentary
There are 3 Dynamic Portfolios to update this month.
- Dynamic Japan 3-Month Portfolio
- Dynamic UK Blended Portfolio
- Dynamic World ex-UK Portfolio
Dynamic Japan 3-Month Portfolio
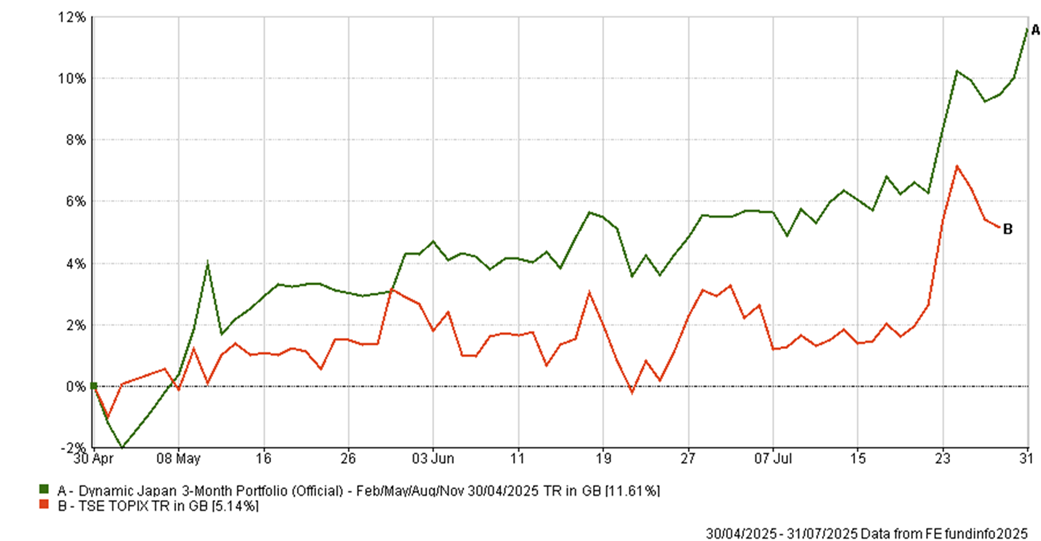
An excellent 3-months with a gain of 11.61%, which is over double the returns of the TSE Topix Index at 5.14%. For the next period, this portfolio, which is made up of one fund, switches into a more value focused Japan fund.
- Since inception: +464.02% vs TSE Topix +127.48%
Dynamic UK Blended Portfolio
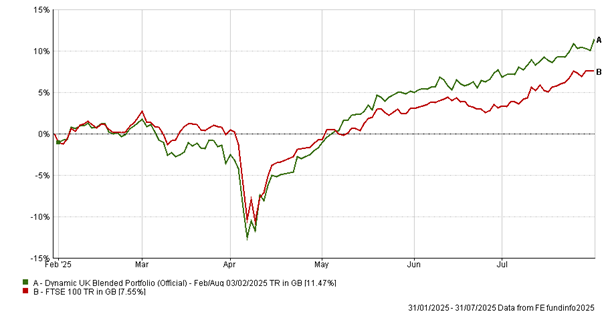
This Portfolio also had a solid 6 months, gaining 11.47% and outperforming the FTSE 100 Index at 7.55%. Looking ahead, we’ll be keeping Artemis SmartGARP UK Equity, but replacing Artemis UK Select with Schroder UK Mid 250 and Ninety One UK Equity Income with Ninety One UK Special Situations as mids/small caps take over.
- Since inception: +1,130.33% vs FTSE 100 +262.94%
Dynamic World ex-UK Portfolio
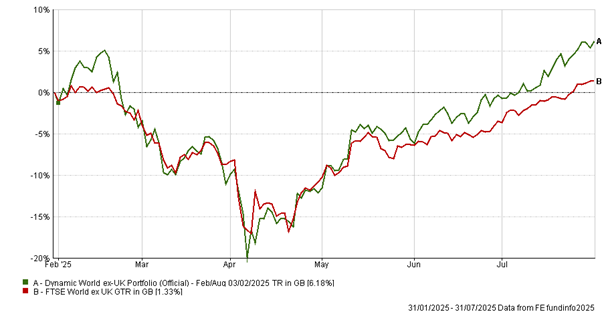
A full sweep of Dynamic Portfolio performances over this review period as Dynamic World ex-UK returned 6.18%, over 4.6x the returns of the FTSE World ex-UK Index at 1.33%. The two US funds are out for Europe and a China fund stays.
- Since inception: +1,277.70% vs FTSE World ex-UK +604.96%
- Dynamic Japan 3-Month Portfolio
-
3-Month Review
Dynamic Japan 3-Month Portfolio: up 11.61%
TSE Topix Index: up 5.14%
Review Period Performance Chart
Performance Table
|
Name
|
3m
|
6m
|
1yr
|
3yr
|
5yr
|
Since Inception
(Feb 00)
|
|
Dynamic Japan 3-Month Portfolio
|
11.61
|
5.14
|
8.76
|
26.4
|
56.95
|
464.02
|
|
TSE Topix Index
|
5.14
|
2.55
|
3.8
|
31.21
|
50.84
|
127.48
|
Risk Table
|
Name
|
Worst Month
|
5 Year Volatility *
|
5-Year Monthly VaR**
|
|
Dynamic Japan 3-Month Portfolio
|
-17.55
|
14.57
|
-8.73
|
|
TSE Topix Index
|
-13.27
|
10.44
|
-6.95
|
Review Table
- Dynamic UK Blended Portfolio
-
6-Month Performance
Dynamic UK Blended Portfolio: up 11.47%
FTSE 100 Index: up 7.55%
Review Period Performance Chart
Performance Table
|
Name
|
6m
|
1yr
|
3yr
|
5yr
|
Since Inception
(Feb 00)
|
|
Dynamic UK Blended Portfolio
|
11.47
|
11.11
|
41.46
|
115.58
|
1130.33
|
|
FTSE 100 Index
|
7.55
|
13.24
|
37.87
|
86.2
|
262.94
|
Risk
|
Name
|
Worst Month
|
5 Year Volatility *
|
5-Year Monthly VaR**
|
|
Dynamic UK Blended Portfolio
|
-21.83
|
13.95
|
-5.72
|
|
FTSE 100 Index
|
-13.41
|
11.03
|
-5.18
|
Review
- Dynamic World ex-UK Portfolio
-
6-Month Performance
Dynamic World ex-UK: up 6.18%
FTSE World ex-UK: up 1.33%
Review Period Performance Chart
Performance Table
|
Name
|
6m
|
1yr
|
3yr
|
5yr
|
Since Inception
(Feb 00)
|
|
Dynamic World ex-UK Portfolio
|
6.18
|
9.13
|
40.85
|
90.39
|
1277.70
|
|
FTSE World ex-UK
|
1.33
|
12.99
|
45.01
|
91.93
|
604.96
|
Risk
|
Name
|
Worst Month
|
5 Year Volatility *
|
5-Year Monthly VaR**
|
|
Dynamic World ex-UK Portfolio
|
-14.81
|
13.92
|
-5.95
|
|
FTSE World ex-UK
|
-12.60
|
11.94
|
-5.59
|
Review
Performance data as of 31/07/2025
*A measure of the size and frequency of short-term changes in the value of an investment.
**Monthly Value at Risk (VaR). A VaR of 6% means that in 19 months out of 20 you should not, on average, expect a fall in the capital value of more than 6% in any one month. The VaR of a typical UK stock market fund is 6%, for reference.