It is the 20th anniversary of the “irrational exuberance" speech by Alan Greenspan. With the US stock market at least as expensive today, should we be worried? Were any lessons learnt?
“What was going on was nutty. Valuations were over the top, and speculation was rampant. It was obvious that Wall Street was drunk and disorderly” observed James Grant, editor of Grant’s Interest Rate Observer
This was the back drop when on 5th December 1996 the then Chairman of the US central bank, the Federal Reserve, posed this question to his rather dry audience at the American Enterprise Institute:
“How do we know when irrational exuberance
has unduly escalated asset values?”
It would have been helpful if Greenspan had been more direct in his warning rather than ask a woolly question midst an otherwise very dry speech.
When journalists saw the recording they immediately understood what was implied (unlike his audience on the night), and predictable headlines followed - “Stocks Worldwide Dive as Greenspan Question Euphoria” screamed the New York Times.
In fact markets only fell briefly, by 2-3%, and markets continued to climb for the next 4 years, building the biggest stock market bubble in history.
The valuation warning
A decent measure of whether there is value in the stock market is CAPE (cyclically-adjusted price earnings ratio), which we’ve written about before. It was 27 in December 1996 (which is way above average), and is at that same level today for the US stock market
It isn’t an indicator for short term market timing, but is reasonably good at identifying the likelihood of you generating decent returns in the 7-10 years ahead.
For example, if you had bought the US stock market in 1996, the theory is that you should have achieved poor returns in the following decade.
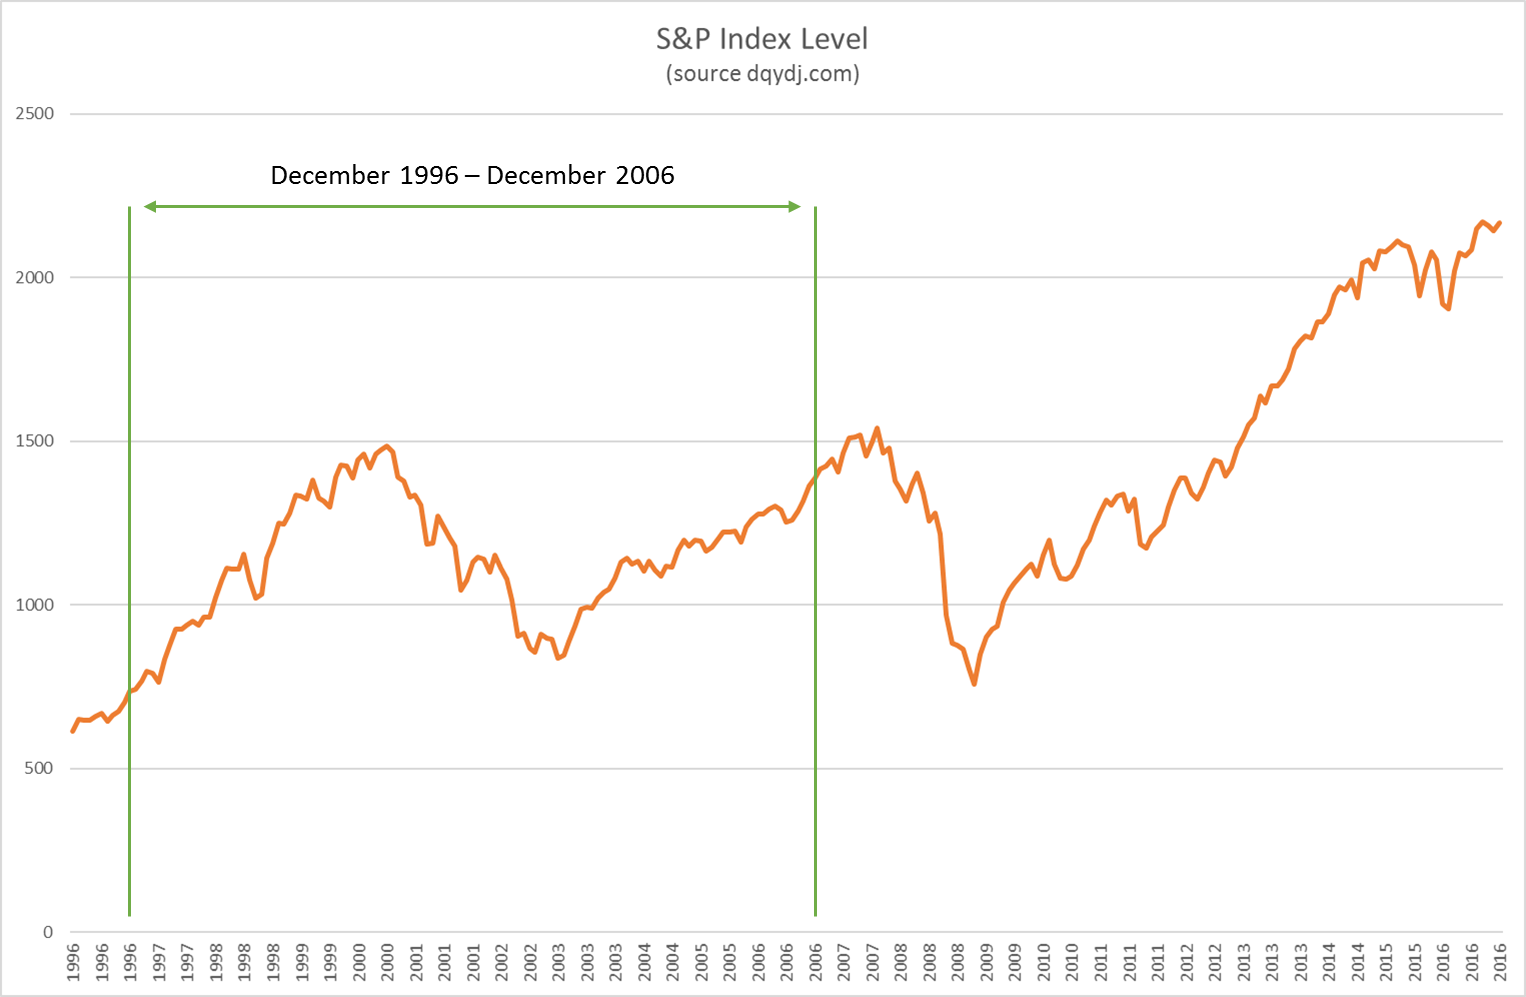
As you can see in chart 1 below, it didn’t turn out quite like that. In fact in the following 10 years the S&P 500 nearly doubled (from 760 to 1,400). But what a nutty ride! After the bubble burst in the year 2000 the market fell by more than 40%, then clambered to a new peak (just!) in 2007, and then in 2008-9 plunged below the level of December 1996.
Phew.
Is it any wonder that the investing public don’t have the extraordinary enthusiasm for the stock market which we saw between 1996 and 2000.
Fall potential? 40%+
Based on where CAPE is now, the US stock market would have to fall about 40% just to get back to the long term average of this indicator. Interestingly we have seen falls of that magnitude twice since 1996.
But, and this is an important “but”, when over-valuation on this scale was encountered in earlier periods (e.g. 1929), it resolved itself by the CAPE indicator falling below 10. In other words there was a very sharp adjustment from over-valuation to under-valuation. This hasn’t happened since 1996, at least not yet. If that was to happen it implies falls in excess of 60% - let that number encourage you stay on your guard.
The lesson?
Though we are typically more concerned with the UK stock market (which isn’t burdened by the same over-valuation), movements in the US can overwhelm other Western markets, so we must pay attention to what is going on over there.
Just because the US market is very overvalued doesn’t mean it MUST fall in the years ahead. Nor that your returns over the next 7-10 years will be some way below average.
But it does mean that the odds of such an outcome are high – so be warned.
And although over a precise timeframe, say 10 years, you might have done just fine from 1996. This was, and remains, a period of extraordinary uncertainty with wild stock market swings to match.
For me that is the lesson for the next decade. With valuations this high in the US, a wild ride is as good as guaranteed – as a minimum.
Chart 1: Cyclically adjusted price-earnings ratio (CAPE) (Source: dqydj.com)
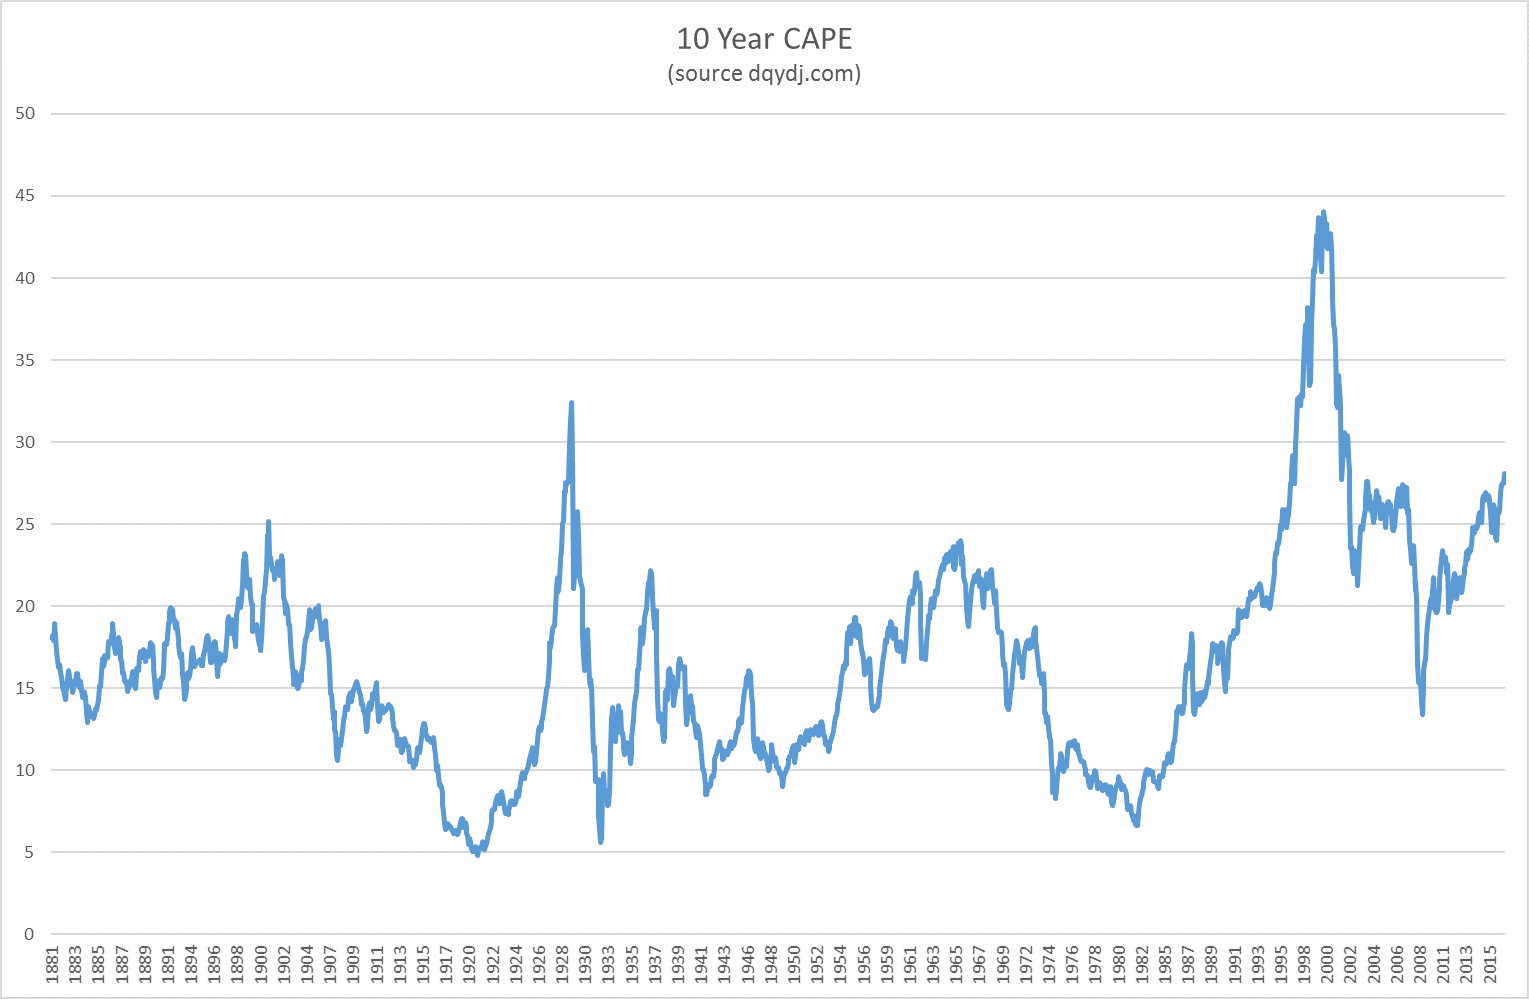
Chart 2: S&P 500 index (Source: dqydj.com)