The Autumn air and the 30th anniversary of The Great Crash of 1987 is accompanying increasingly negative rumblings from the investment industry's chattering classes.
If the stock market does head lower, it is a good time to consider how far down might be the most significant stopping point.
Managing your expectations is vital.
I invariably start my analysis of the stock market with a pencil and a ruler. Here’s why (aside from the 30 years of experience informing me how useful is this simple tool).
Investors (including the professionals who might be managing £billions) are both emotional creatures and creatures of habit. On a graph of any stock market it is possible to observe where those investors got into the habit of either buying or selling in the past.
For example, if you look at the first chart at the end (of the US stock market), the red line shows that investors have got into the habit of buying when the US stock market fell to around 1,850 – what we call a support line for the market, and it is just over 25% below where the market is today (2,540).
You might well argue that surely we can and should be more scientific than that. Yet, over relatively short periods the markets are driven by sentiment, and the emotions of fear and greed. And when markets are very volatile, particularly when the trend is down, investor decisions (that includes you and I) are increasingly driven by fear. In such a situation a habit which stood us in good stead previously (in this case buying at around 1,850) acts like a comfort blanket, putting a dampener on the market falling much further.
If you have read to this point you might think that the actions of investors (or this analysis) are infantile. Perhaps you are right. But it is precisely because investors act like this (you and I included) that governments, central banks, regulators, the huge investment banks and academia spend so much time and effort on what is called Behavioural Finance:
“Behavioral finance is a field that seeks to combine behavioral and cognitive psychological theory with conventional economics and finance to provide explanations for why people make irrational financial decisions”
So you can have a pretty good stab at how far the market might fall without having to consider why the market might fall to that level. It is important to recognise that we aren’t trying to forecast that the market WILL fall 25%, rather trying to visualise to where the market might fall. This is very useful if you want to succeed at investing because you can rehearse how you will behave if the market hits that level e.g. not panic selling, but applying a stop-loss on the way down, and building a “shopping list” of what to buy when markets are lower still.
I don’t want to be melodramatic, but you should also consider the line of support at even lower lewels. This is 1,100, that is 56% lower than today. Remember, don’t try and forecast whether that might happen, but rather what action you will take (how you will behave) if it happens.
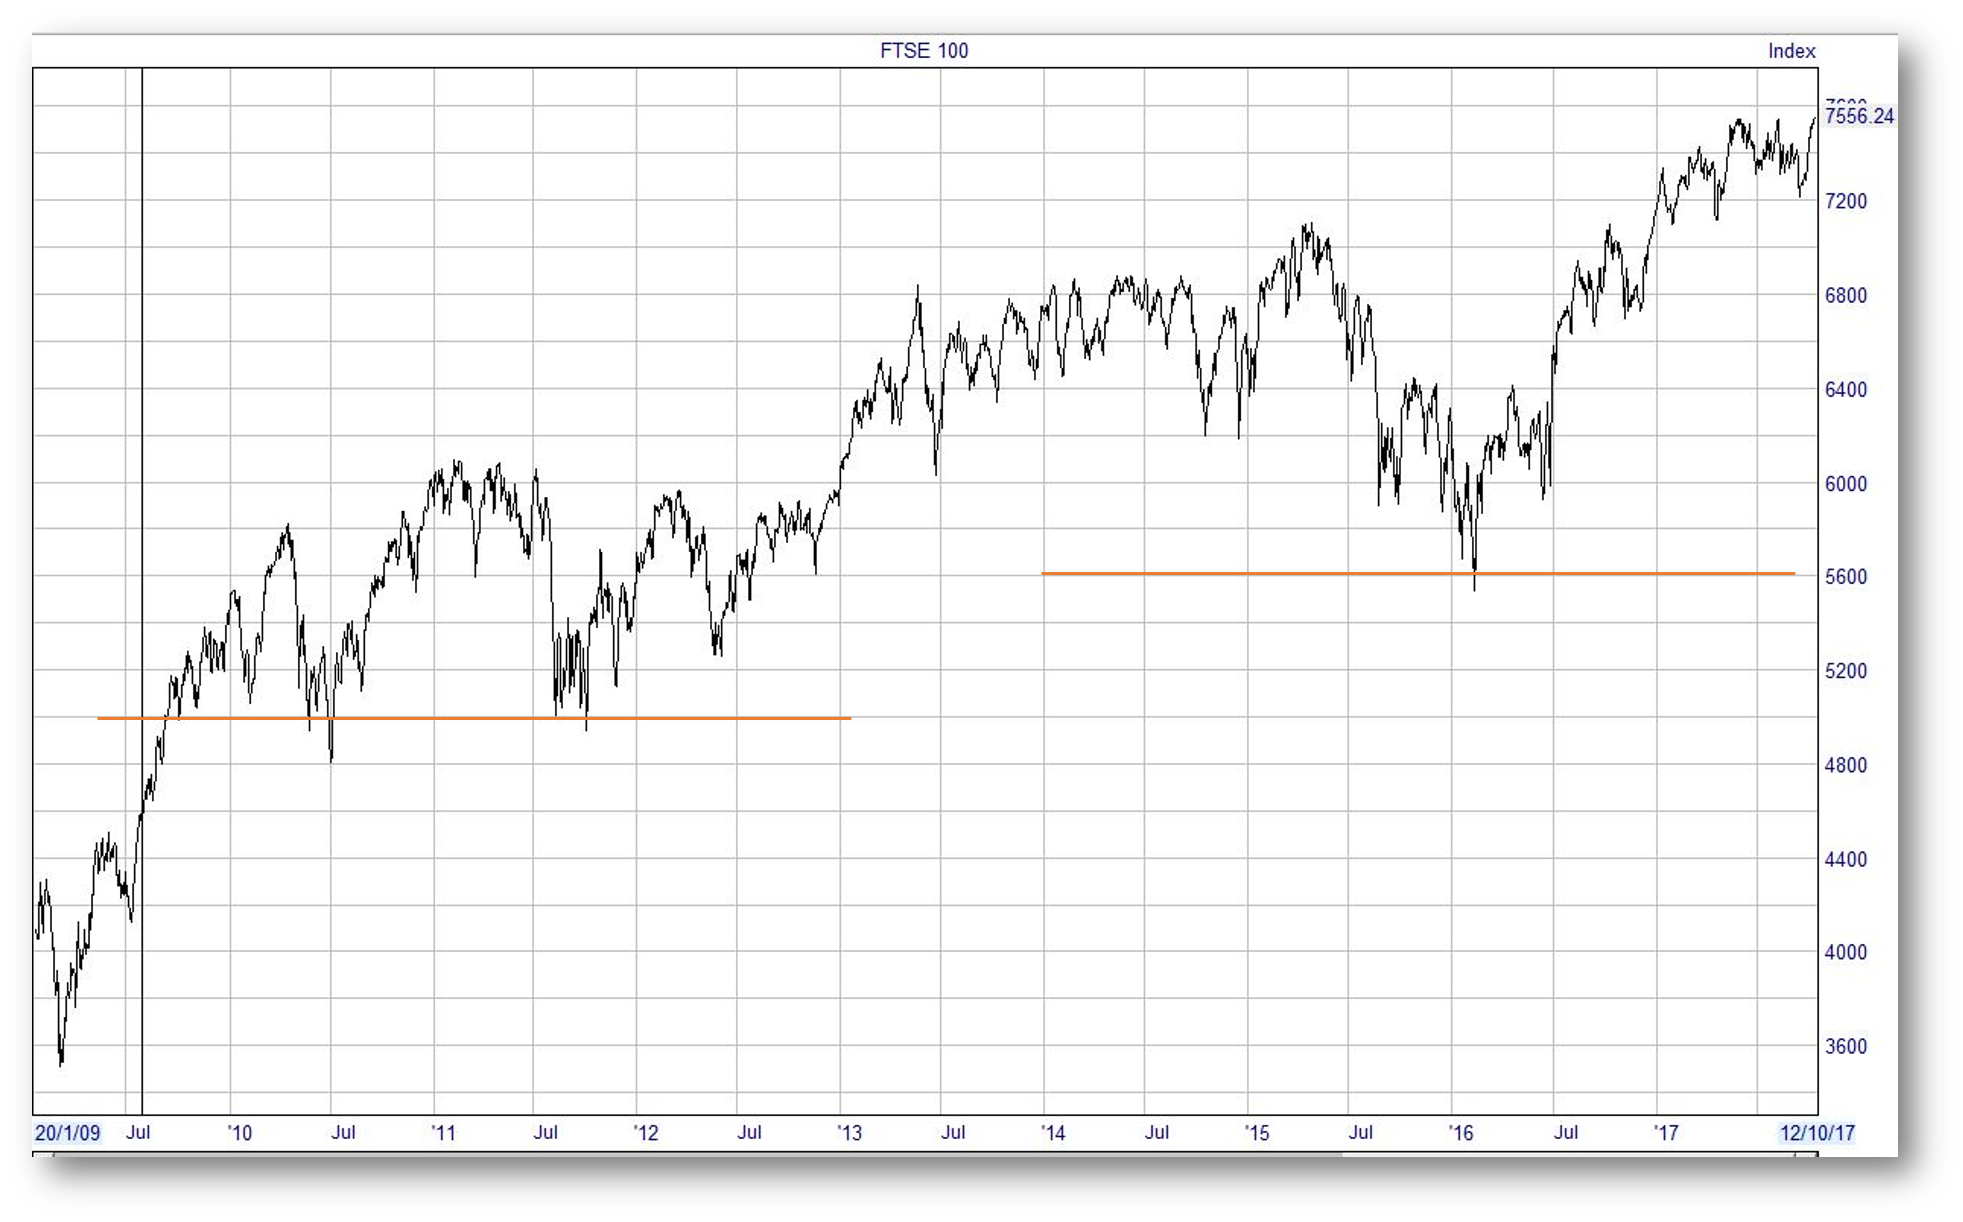
Turning to the UK stock market, it is interesting that if the FTSE 100 index fell 25% today it would right to the line of support around 5,600 (though the greatest support is around 5,000 (34% lower than today).
N.B. These are not predictions. They are more observations. Such roadmaps help investors not to be too emotional as these market episodes unfold.
ACTION FOR INVESTORS
- For existing investors in the market, manage your expectations
- Build into your plan how you will respond if markets head lower
- For investors who have kept some powder dry, this will help you visualise a point to enter the market – and not be too frightened to do so.
FURTHER READING
Chart 1
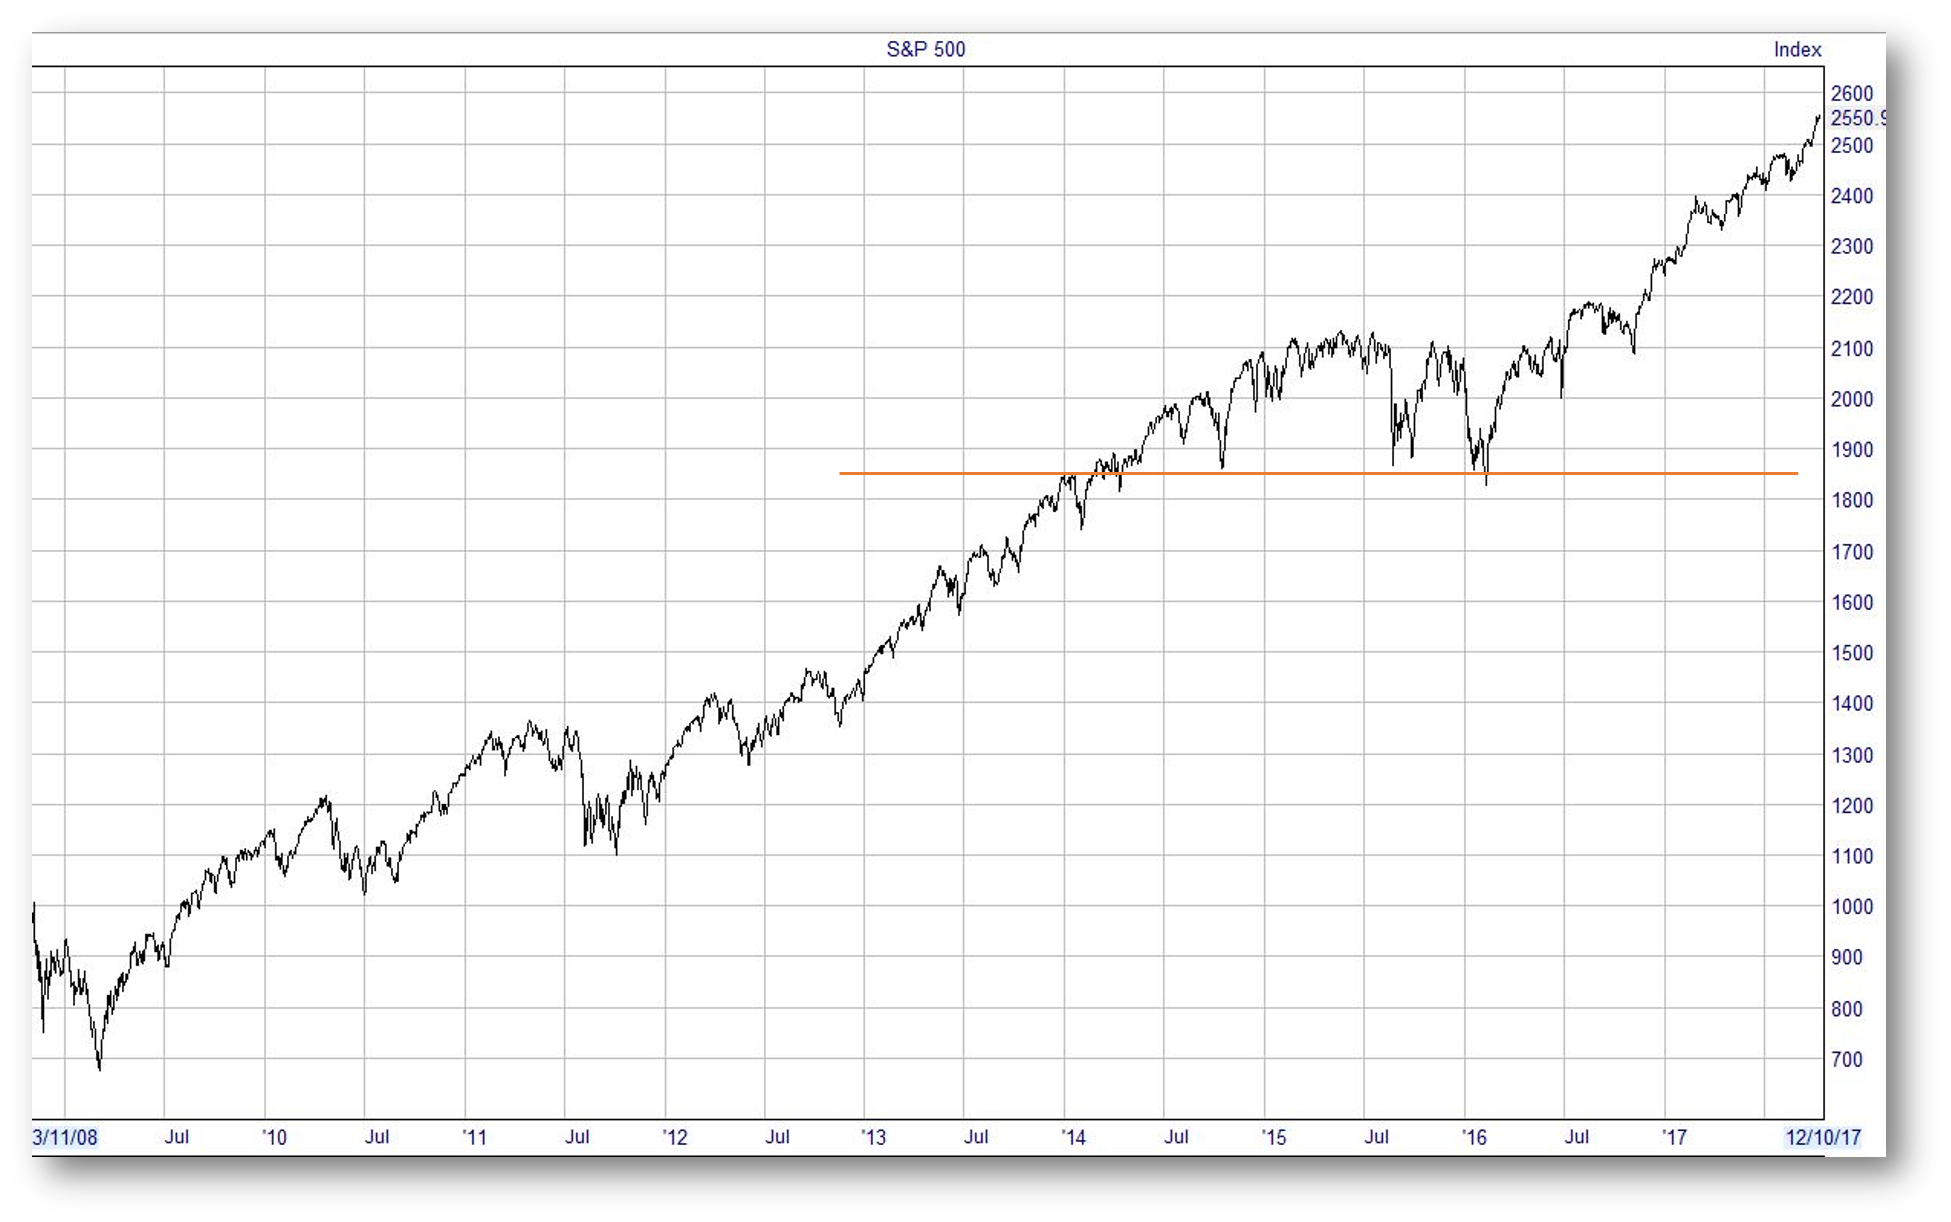
Chart 2