 The chart for this week shows a fantastic opportunity for investors. We often talk about the potential from middle class growth outside of the developed West. This shows the scale of the changes coming round the corner.
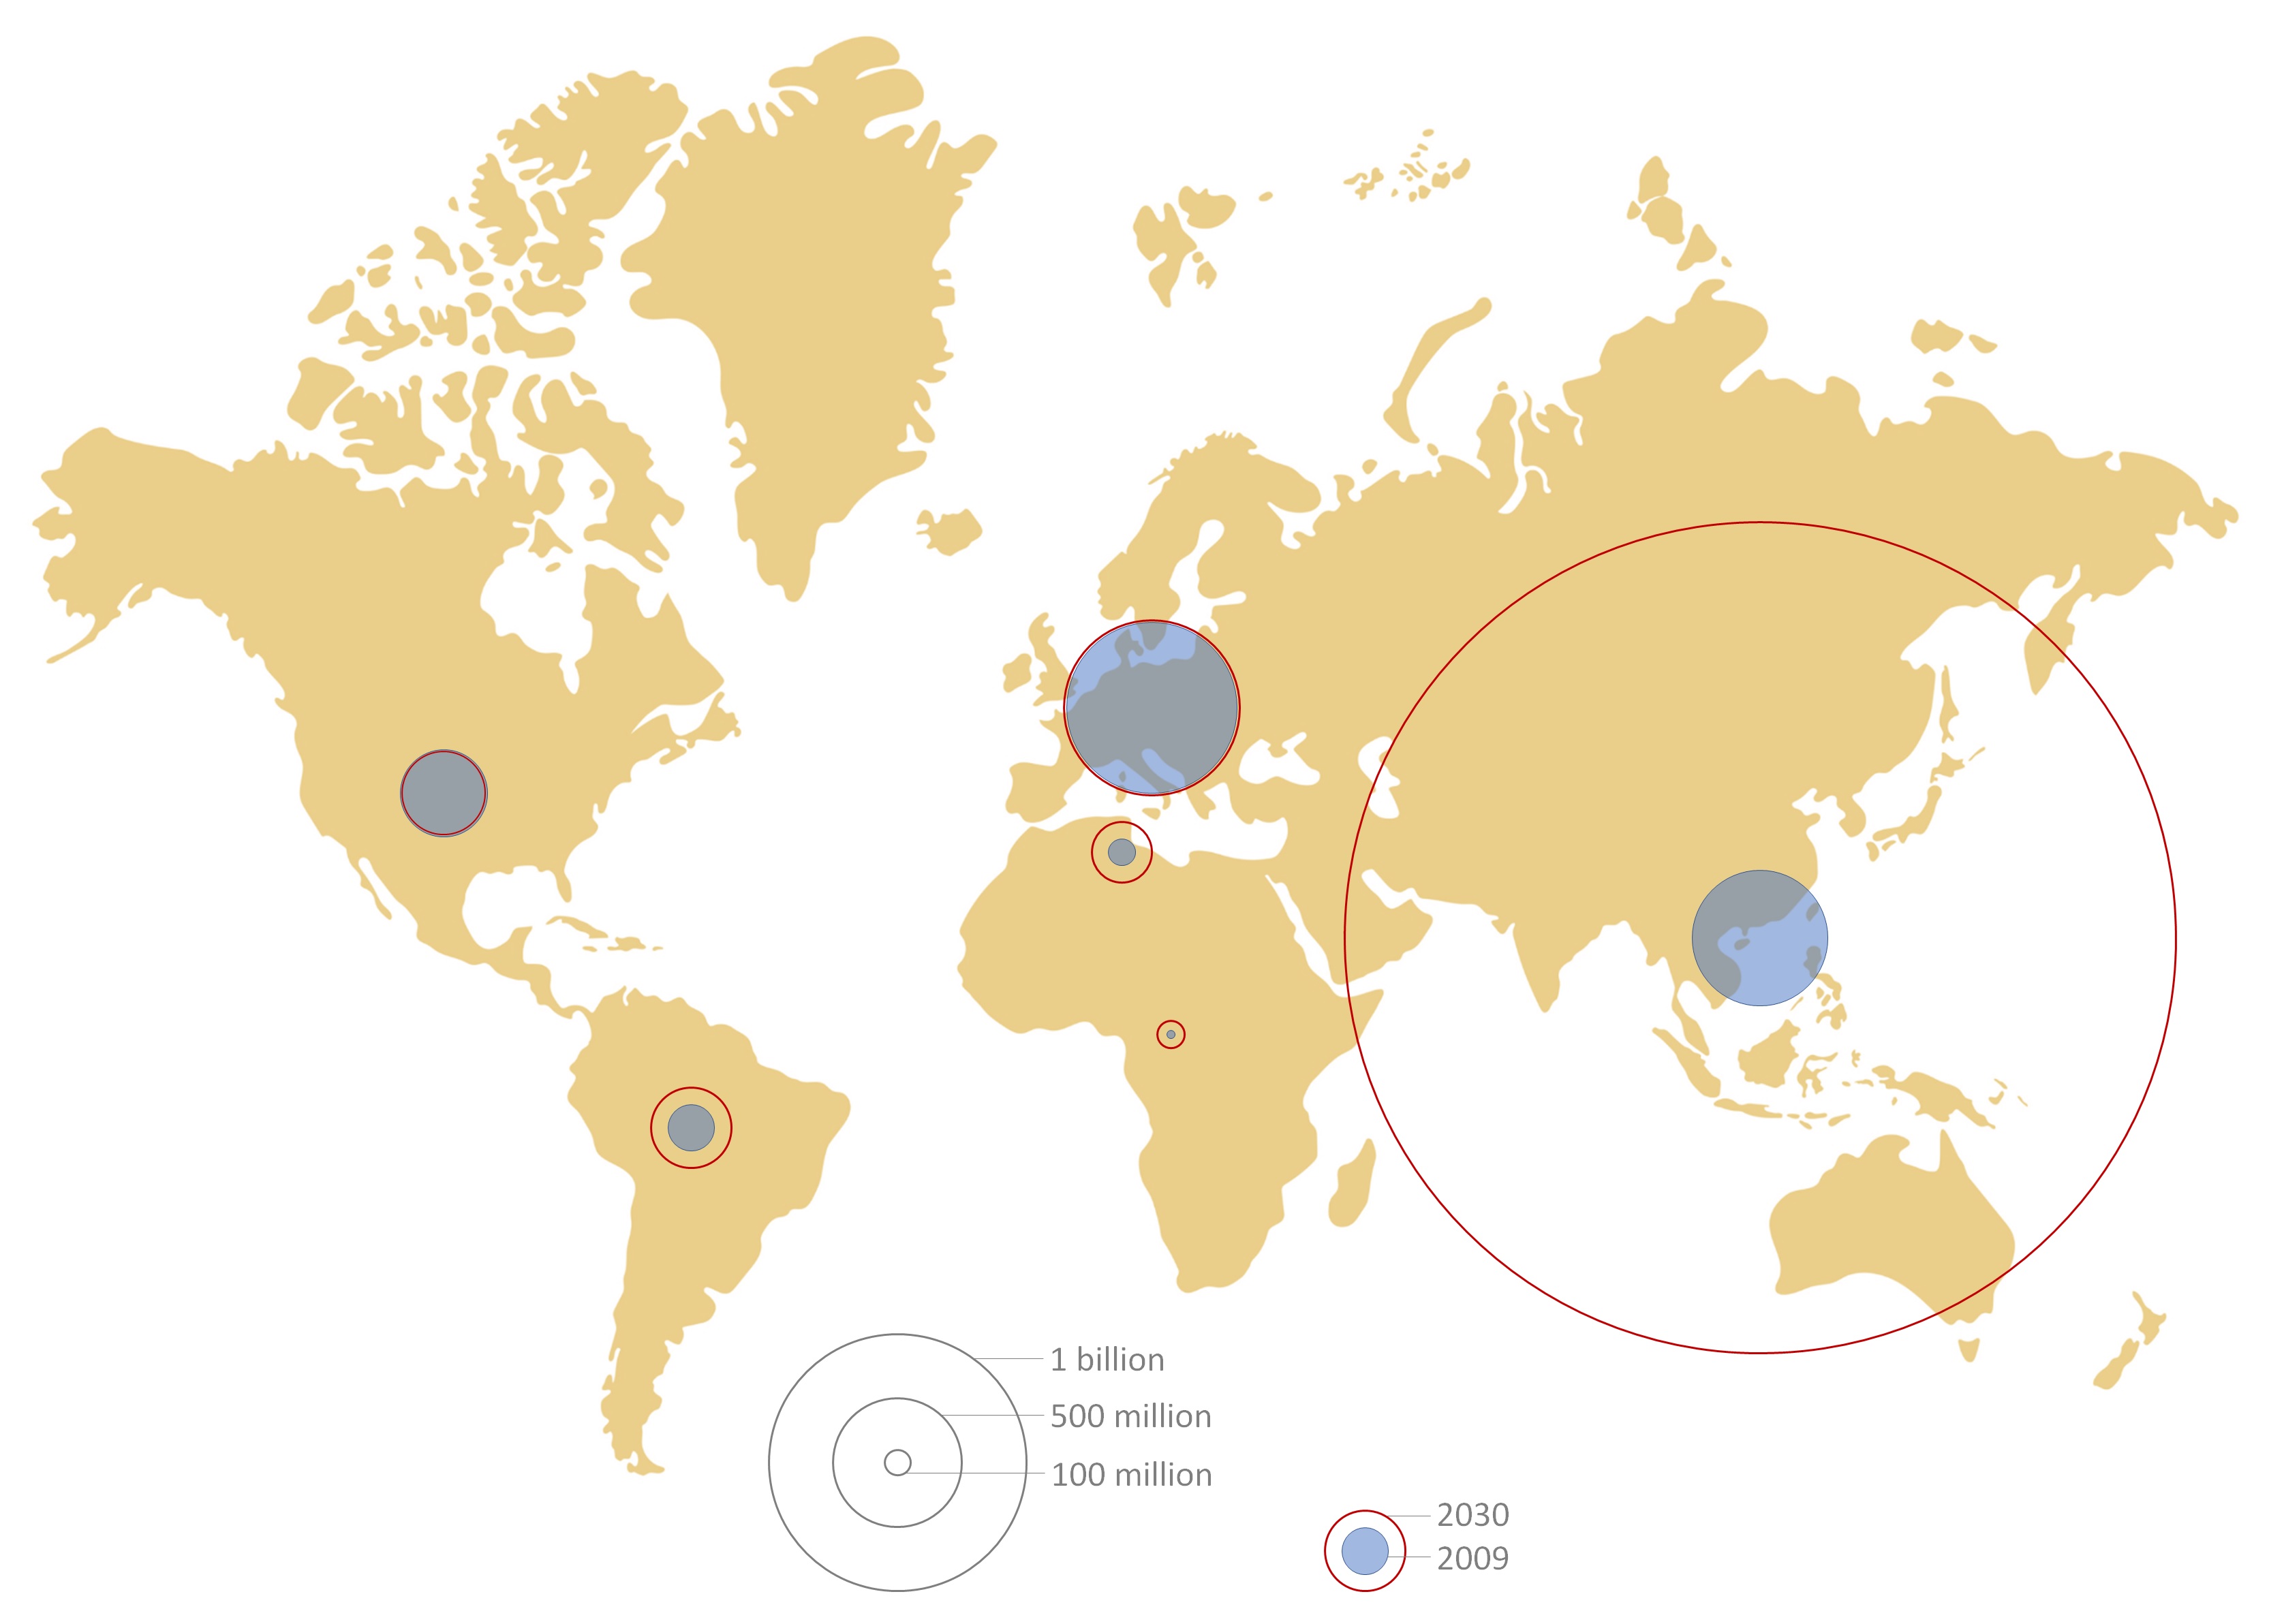
The map shows the size of the middle class populations around the world in 2009 (blue circle) and the predicted population size in 2030.
In the old, indebted west, the middle class population barely grows at all. In fact it shrinks in the US. Emerging economies are where the growth is.
- Central and South America nearly doubles from 181 million to 313 million.
- Sub-Saharan African is predicted to more than triple from from 32 million to 107 million.
- But the huge growth is in the Asia-Pacific region where goes from 525 million to 3.2 billion. That's 6 times the size of the middle class population in 2009.
In 2030, the middle class population of the Asia-Pacific region is predicted to make up 66% of the global total, while North America and Europe combined will shrink from 54% in 2009 to 21% in 2030.
Of course, there will always be investment opportunities in Europe and North America but this should leave investors in no doubt as to where the growth opportunities are in the coming decades.
FURTHER READING
Chart: Growth of middle classes around the world, 2009 and 2030
Data source: Brookings Global Economy and Development