 Here is a sneak peak at an extract from Brian Dennehy's forthcoming book; we hope you find this preview interesting.
Below is an extract from my forthcoming book; I hope you will find this sneak preview interesting. Do keep an eye on your inbox a special offer on the upcoming book launch...
This one does run a bit longer than normal. Grab a mug of tea!
Chapter 18.
What Can Go Wrong
Nothing is perfect.
No approach to investing is perfect.
Nor is any single way to select funds.
I have shown you some impressive results if you adopt a straightforward and proven process for selecting funds. But we must not be complacent, and work to understand:
- What might go wrong.
- What you can do about this.
I have read volumes about Momentum investing – the research stretches back decades, starting in the 1930s. And uniquely, I have been crunching the numbers in the context of funds since 2002. So, I have built a decent knowledge on this issue on top of 30 years of experience, both advising, writing and researching.
The national press cover this issue from time to time and they very kindly tend to get in touch. They also ask the view of others, and this is where it gets interesting. While very experienced in years, my peers have typically not crunched the numbers as I have, nor ever used Momentum as a tool for selecting funds for clients.
When these other pundits are asked “what are the problems with Momentum investing?” they tend to repeat what someone else said, who also hadn’t crunched the numbers.
So, let’s explore the two oft-mentioned problems and see if they hold water.
- It is claimed that Momentum fails at turning points for markets.
- It is claimed that Momentum is more risky.
1. Does Momentum fail at turning points for markets?
To recap, you buy a fund today because it was the top performer of its kind in the last 6 months – 6 months later you repeat this process, selling the current holding and buying the latest top performer – this is the process built into our Dynamic Fund Ratings.
Now suppose that you bought this fund one month before the stock market went into a tailspin. You might expect that the funds that had led the performance tables in the prior 6 months will now lead the market lower, losing more than most of their peers.
So, let’s explore that at the time of the market collapse from January 2000 (as the tech bubble burst) and from September 2008 (when Lehman Brothers went bust and took the world to the brink of Great Depression II).
Turning Point 1: The bursting of the tech bubble
January 2000. This was the top of an extraordinary bull market, on some measure the most extreme in 300-odd years. The bubble was about to burst, tipping us into an ugly bear market of three years’ duration.
Using our Dynamic Fund Ratings to select UK growth funds, in January 2000 you would have invested into these three funds:
- Artemis Capital
- Artemis UK Select
- AXA-Framlington UK Select Opportunities
In July 2000, you would have switched out of those funds into the latest top-rated funds, and so on, every 6 months.
In the table below, we show the performance of this Dynamic Fund Portfolio compared with the FTSE 100 (representing the UK stock market) and the average UK growth fund (i.e. populating the UK All Companies fund sector).
By the end of the first 6 months (June 2000), our portfolio was up 6.86% compared to down 7.87% for the index, a difference of 14.73% in just 6 months.
So clearly, no underperformance of our Momentum-style portfolio at the turning point from bull market to bear, as some have suggested there should have been.
Table 1: Dynamic Fund Portfolio (DFP) vs FTSE 100 and UK All Co’s sector (2000-2005)
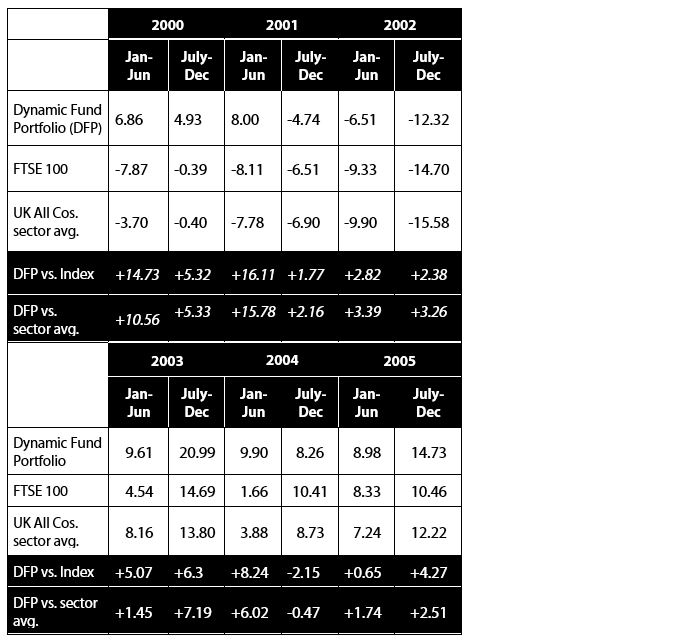 If you look at the table above, in all but one period (July-Dec 2004) our Dynamic Fund Portfolio outperforms the stock market index and the sector average. And in that period the portfolio is still positive, it just doesn’t rise as much as the other two.
That is a superb testimony to the Momentum strategy during this period.
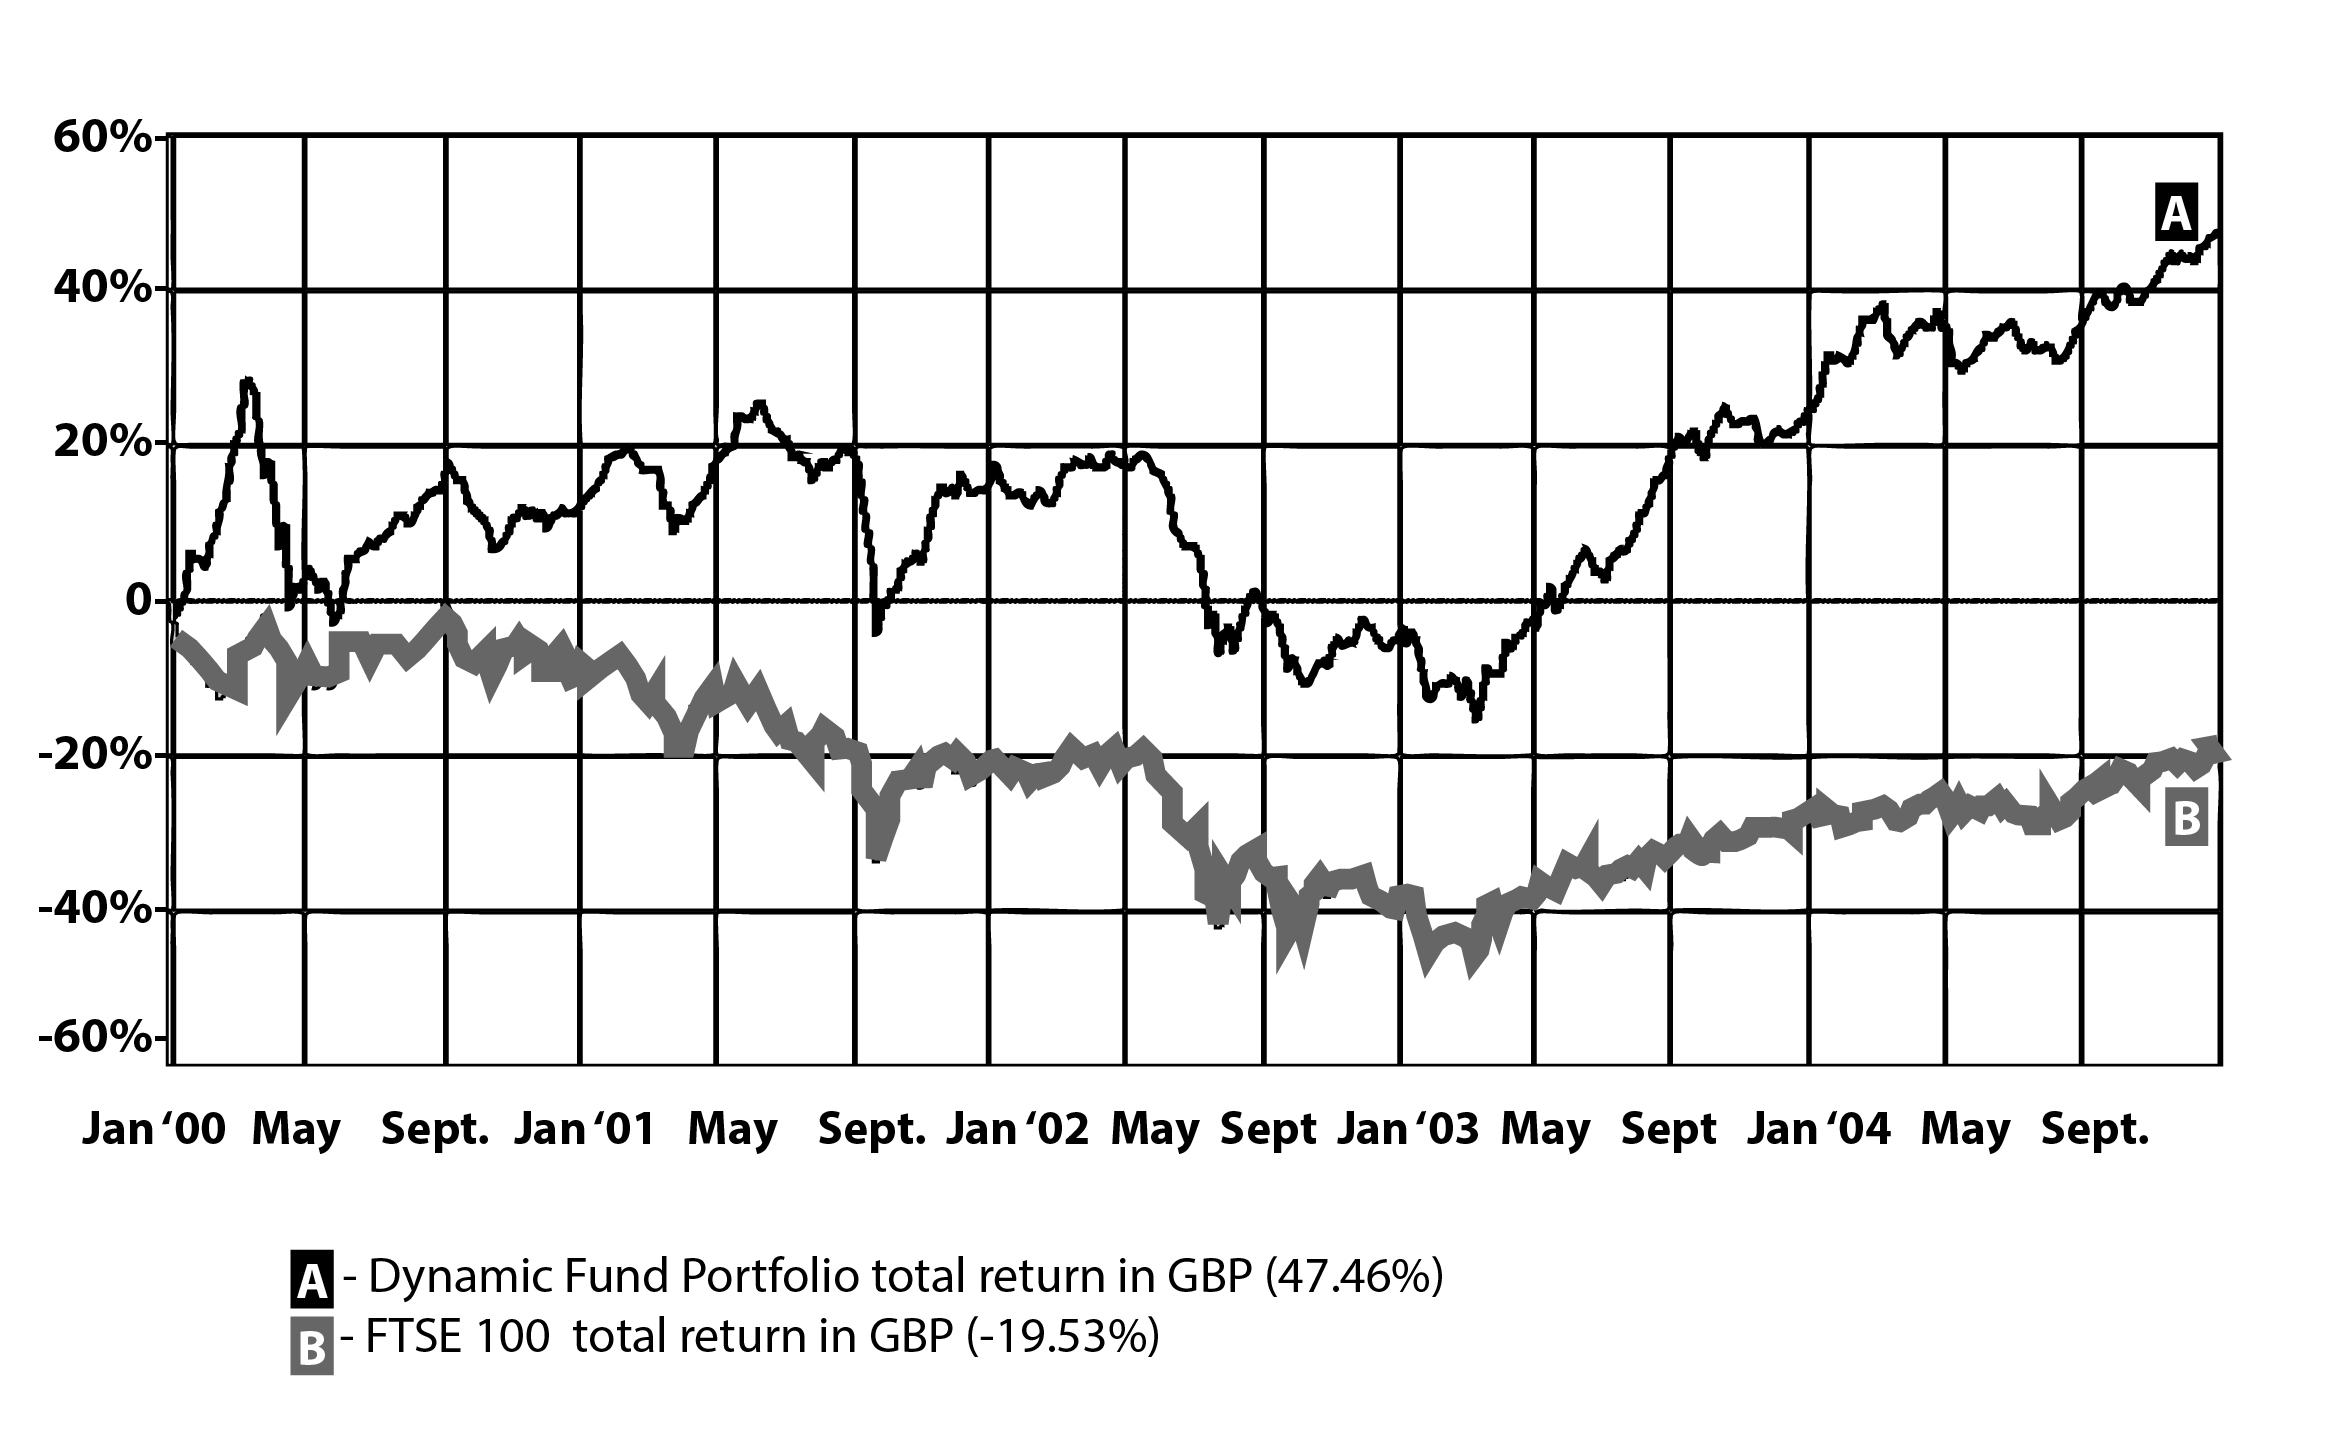
You can see this progress in the chart.
Chart 6: Dynamic Fund Portfolio vs FTSE 100
Turning point 2: Lehman Brothers bust in 2008
More recently, the failure of Lehman Brothers. in September 2008 triggered sharp falls across the globe.
If you had begun investing into the UK stock market January 2008 using our Dynamic Fund Ratings, you would have invested into three funds:
- JOHCM UK Opportunities
- Newton UK Equity
- Threadneedle UK Extended Alpha
In July 2008, you would have switched out of those funds, as you now know, choosing the latest top funds using our Dynamic Fund Ratings. And so on, every 6 months.
In the table below, for each discrete six-month period, we show the performance of the Momentum-style Dynamic Fund Portfolio compared with the UK stock market and the average UK growth fund (which populates the UK All Companies sector).
For example, at the end of the first six-month period, June 2008, the Dynamic Fund Portfolio was down 8.56%, whereas the index was worse, down 10.82%.
Table 2: Dynamic Fund Portfolio vs FTSE 100 and UK All Co’s sector (2008-2010)
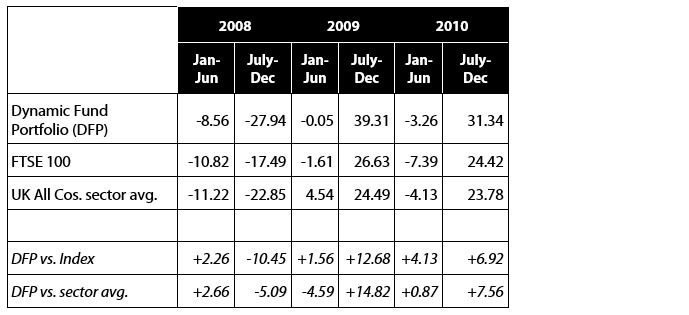
Our Momentum-style portfolio fell more than the index in the next 6 months, was marginally better in the first half of 2009, and was outstanding from then on versus the index and the average UK growth fund.
So that forensic look at each six-month period doesn’t reveal any great weakness with Momentum.
But perhaps we’re missing something, so let’s look at this another way.
The low for the UK stock market was March 2009. From January 2008 to that low, the Momentum portfolio fell by 46%. That compares to a fall of 42% by the FTSE 100 over the same period. A small difference, certainly not worrying.
Looking at the chart below, you can see that our Dynamic Fund Portfolio (black line) returned to positive territory in September 2010 compared to the starting point of January 2008, and it went into positive territory two months faster than the FTSE 100.
Chart 7: Our Dynamic Fund Portfolio vs FTSE 100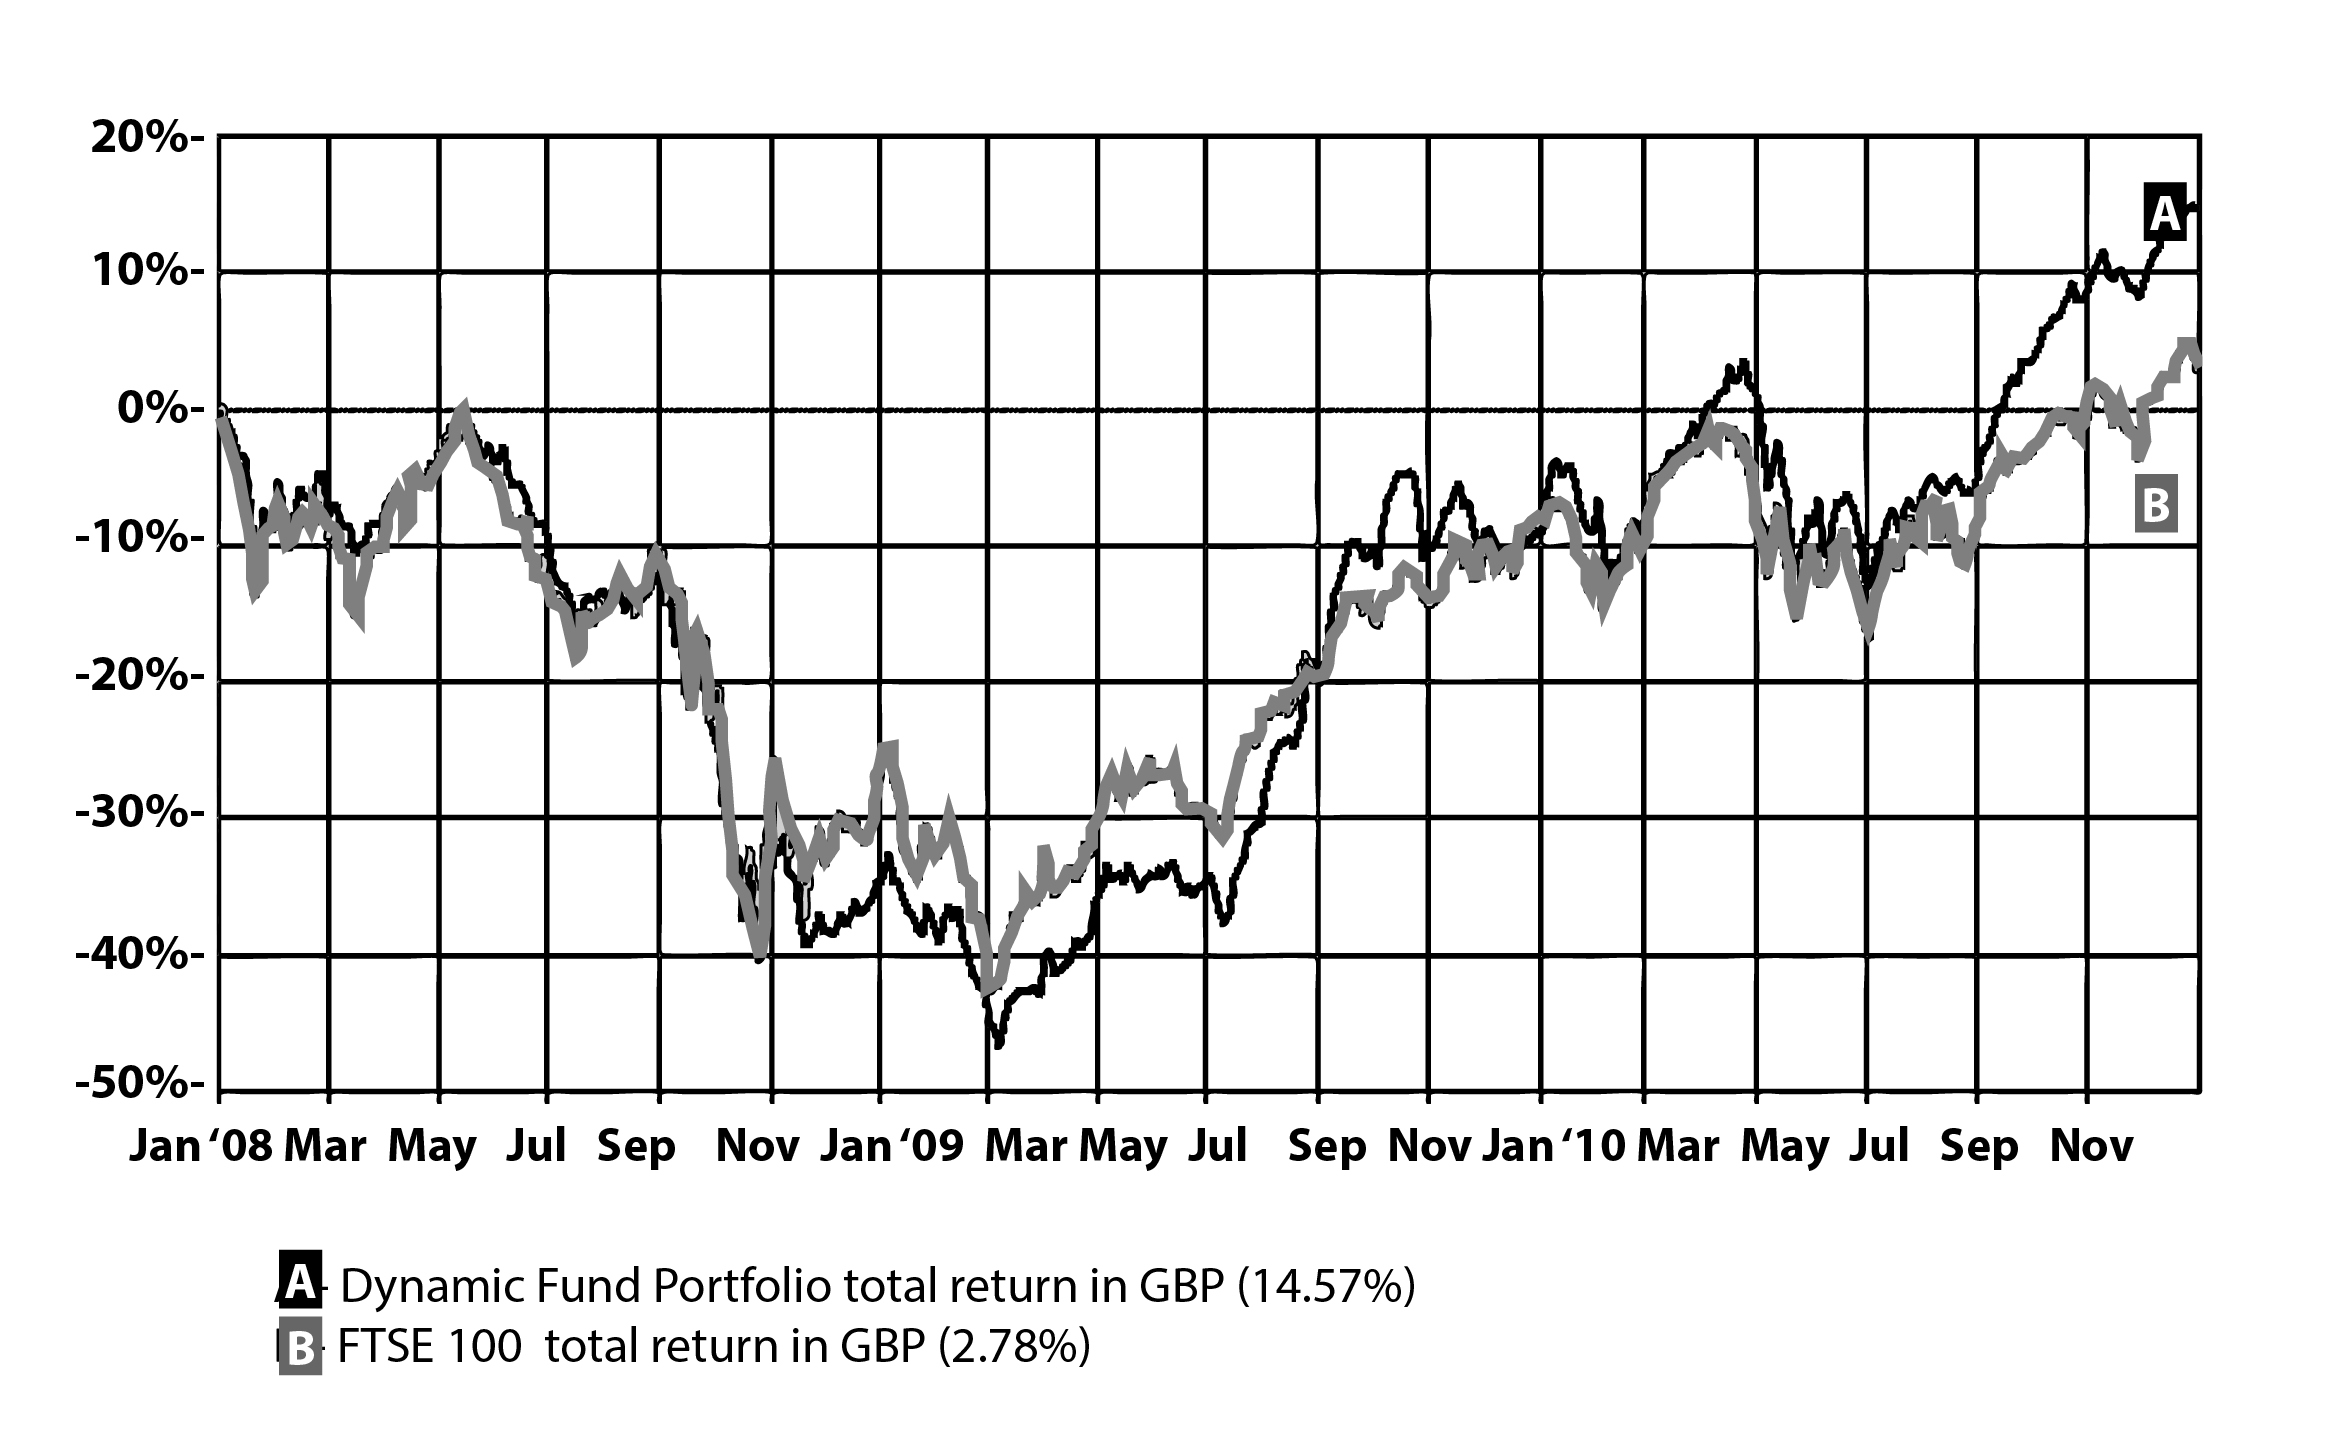
2. Is Momentum more risky?
For an investor in funds, risk means volatility, in other words how much a fund goes up and down. If it is more risky, it will go up and down more than its peers.
We considered this to some extent with the last two examples of turning points – when we saw nothing worrying that would stop you from exploiting a Momentum-style process for selecting funds versus buying an index tracker.
There are a number of other measures to judge the riskiness or volatility of any investment approach.
Table 2A: Dynamic Fund Portfolio vs FTSE 100 and UK growth sector (1994-2015)
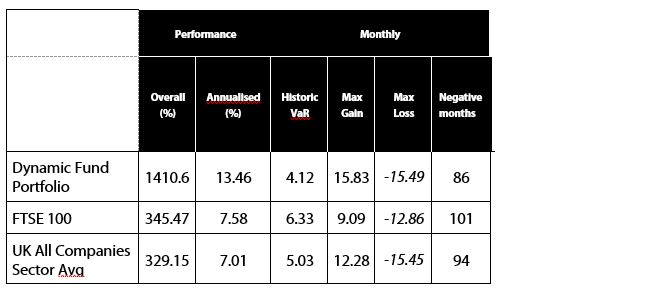
The above table shows a number of statistics that enable you to compare our Dynamic Fund Portfolio with both the UK stock market index and the average UK growth fund.
For instance:
The Momentum-style Dynamic Fund Portfolio had fewer negative months than either the index or the average UK growth fund.
The maximum monthly loss was slightly higher at -15.49% for the Momentum-style portfolio versus the index and the average UK growth fund.
However, that is more than compensated for by the maximum monthly gain, which was 15.83% for Dynamic Fund Portfolio vs. 9.09% for the index.
The VaR is “Monthly Value at Risk”, a more technical measure. The VaR figure for the average UK growth fund is 5.03%. This means that in 19 of those months out of 20 you should not, on average, expect a fall in the value of more than 5.03% in one month. In the 20th month the loss might be more severe (October 1987 being an extreme example, with a 20%+ fall in one month).
For the Dynamic Fund Portfolio, the monthly risk of 4.12% is less than that of both the average growth fund (5.03%) and the index (6.06%).
It is clear from all of the above that there is no evidence that a Momentum-style process for selecting funds is more risky than alternatives, on the contrary. Those “experts” who trot out these supposed drawbacks simply haven’t done their homework – at least not with funds.
Nonetheless, there are other risk issues you should take more seriously when thinking about your approach to investing generally, and selecting funds in particular – and these apply whatever your approach, even if you only buy index trackers, and even more so if you buy individual shares.
Sometimes bad things happen, worse than 2000 and 2008.
The Japan Problem.