 The 3 year anniversary of the launch of Neil Woodford’s inaugural fund: Woodford Equity Income is coming up (2nd June). After a good start, the last year has been poor. These are the facts.
Neil Woodford left Invesco Perpetual in 2013, set up his own shop and now has 3 funds with his name on them: Equity Income, Patient Capital, and Income Focus. An army of loyal investors followed him from Invesco and piled into his first fund Woodford Equity Income. It was huge almost overnight, and today is around £10bn.
Has the loyalty of his fan club been repaid by outstanding performance? Three years is a decent period over which to judge. Here are some facts:
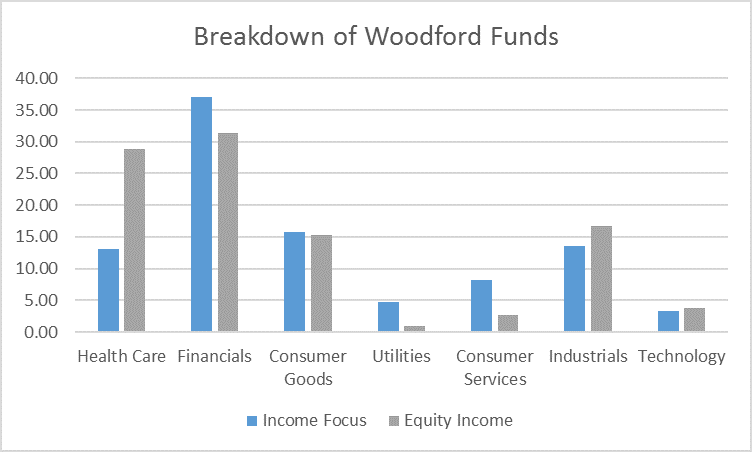
- Since June 2014 the results look good (+35.3%).
- On a total return basis (with income re-invested), he has comfortably outperformed both the FTSE (+21.4%) and his old fund (+23.6%). See chart 1 & table 1 below.
- However, over the last 12 months his fund has struggled…
- … underperforming the sector by about 5%, and the FTSE 100 index by 12% (table 2, chart 2).
Worse still, Neil’s fund has also horribly underperformed our preferred equity income funds over the last year. For example, he generated 9% less than Schroder Income, and 14% less than JOHCM UK Equity Income.
At £10bn in size it makes changes in strategy pretty difficult. He has sold positions in healthcare (GlaxoSmithKline) and some of his tobacco (British American Tobacco), allocating this to UK plc in the form of Lloyds Bank and a brick manufacturer. This follows a long period avoiding banks.
He also holds Lloyds in his new Income Focus fund and the difference in strategies is evident (chart 3). Income Focus has only 13% in healthcare stocks compared with 28.9% in the Equity Income fund. Financials also make up a larger proportion of the Income Focus fund (37% vs 31%).
If forced to choose between the two we would still go for the Income Focus fund over the Equity Income fund. But there are even better opportunities investors shouldn’t overlook, which we have covered before here and here.
ACTION FOR INVESTORS
- The fund has performed well over 3 years…but has struggled in the last 12 months.
- At over £10bn strategy changes are difficult to implement.
- The underperformance and loss of momentum over the last year should be a concern for holders of this fund
FURTHER READING
Table 1
| |
Growth (%)
|
|
|
|
Name
|
Total Return
|
Annualised
|
Fund Size (£m)
|
1 year volatility (%)
|
|
Woodford Equity Income
|
35.27
|
10.74
|
10,067
|
9.45
|
|
Invesco Perpetual High Income
|
23.55
|
7.4
|
11,266
|
7.01
|
| |
|
|
|
|
|
UK Equity Income sector
|
22.11
|
6.98
|
|
7.75
|
|
FTSE 100
|
21.35
|
6.75
|
|
7.97
|
Table 2
| |
Performance (%)
|
|
Name
|
02/06/2016 to 18/05/2017
|
02/06/2015 to 02/06/2016
|
02/06/2014 to 02/06/2015
|
|
Woodford Equity Income
|
12.65
|
0.03
|
20.04
|
|
Invesco Perpetual High Income
|
11.97
|
-3.03
|
13.79
|
| |
|
|
|
|
UK Equity Income sector
|
17.32
|
-4.42
|
8.89
|
|
FTSE 100
|
24.89
|
-7.08
|
4.58
|
Chart 1
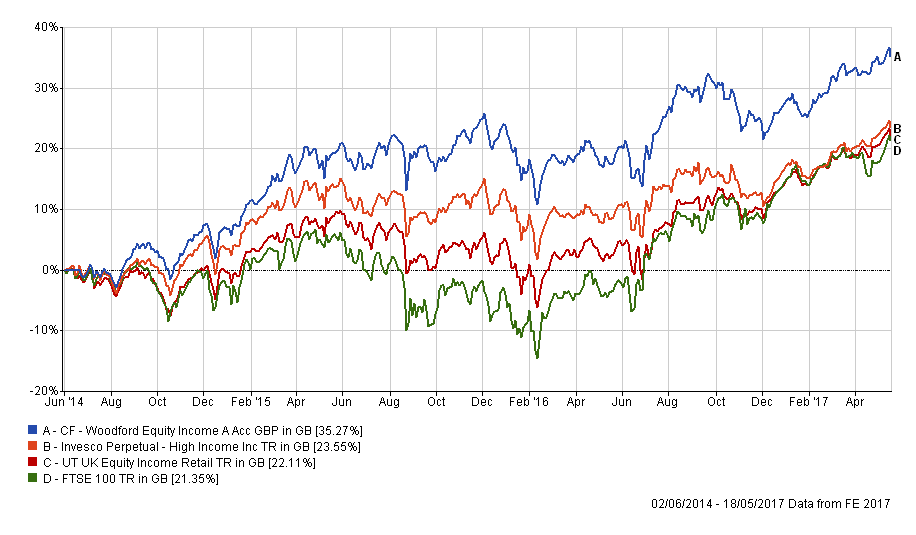
Chart 2
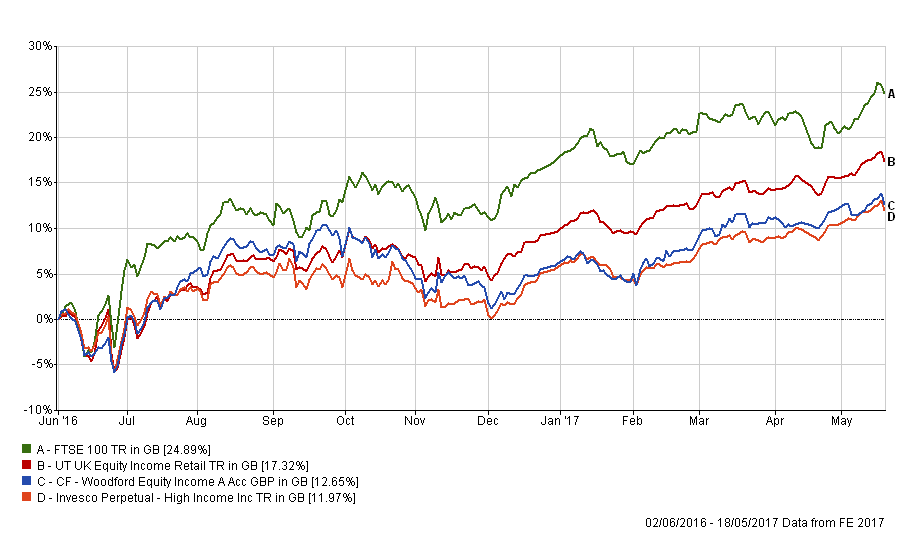
Chart 3