As ever, if you have any questions about the below research please do not hesitate to contact us.
The new funds for each Dynamic Portfolio will be listed below, or alternatively you can view the new funds on the designated Portfolio Library page.
Performance Graphs will be over their review period unless stated otherwise.
The Dynamic Portfolio’s below are sorted A-Z.
Commentary
There are four Dynamic Portfolios up for review in April:
Bonkers 3-Month Portfolio
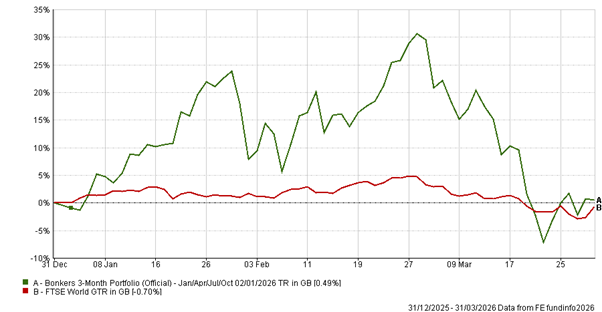
A somewhat crazy 3-month period that can be split into two distinct periods to bring to life the performance swings of the portfolio. The first 8 weeks of the year saw the portfolio (and it’s underlying holding in a strategic metals fund) soar 30%. However, since the start of March the fund retreated all of these gains and then some, before regaining a touch to end the period basically flat. Having a trailing stop loss in here would’ve been a shrewd move, but it is Bonkers after all!
· Since inception (Oct ’99) +6,458% vs FTSE World +732%
Dynamic Commodities Portfolio
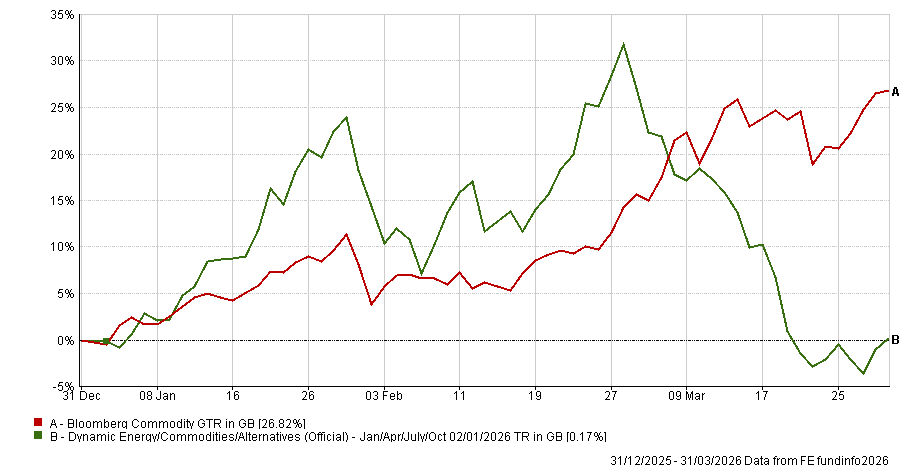
Given the underlying holdings of this portfolio more or less mirrors that of the Bonkers Portfolio above, a very similar pattern emerged, with precious metals hit hard in the wake of a new global conflict, much of this sell-off was driven by profit taking given the large and rapid gains made towards the back end of 2025/early 2026. The three new funds all have a heavy oil bias, unsurprisingly, though by the time this has been published oil could have moved another +/- 10%.
· Since inception (Jan ’09) +678% vs Bloomberg Commodity Index +59.47%
Dynamic Global Portfolio
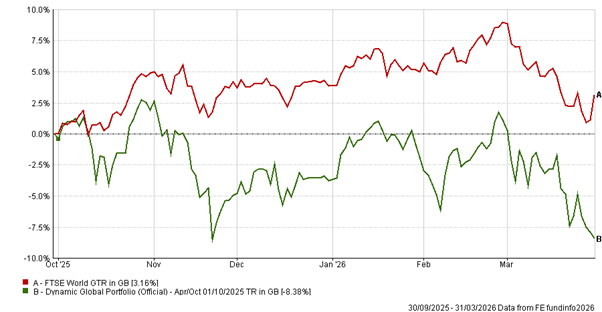
The portfolio never really got going over the past 6 months, any momentum that was picked up in February swiftly reversed with the onset of the war. Asian markets, notably Chinese (of which two of the funds had a heavy weighting to) underperformed since the onset of the conflict.
It’s comparison to the benchmark is largely irrelevant over the period, given its hugely overweight exposure to Asian equities.
· Since inception (Oct ’99) +1,843% vs FTSE World +732%
Dynamic UK Smaller Companies Portfolio
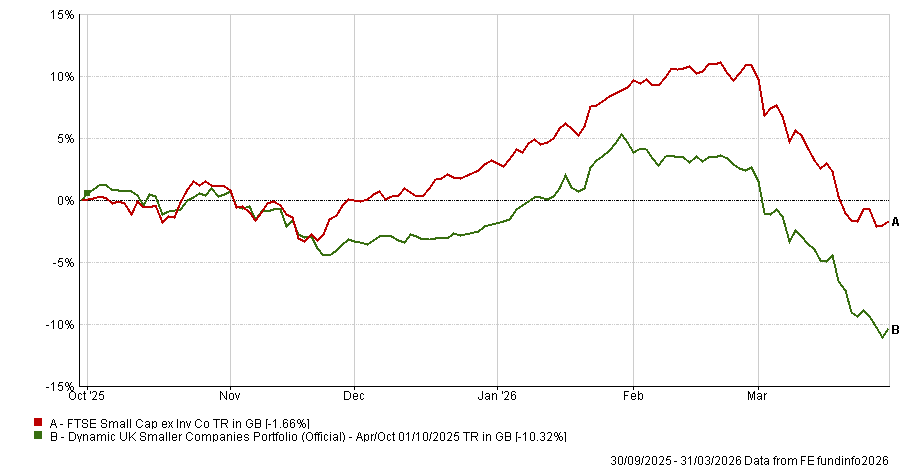
Again a portfolio that saw it’s early (albeit modest) momentum reverse with the negative impact from the conflict in the Middle East. Interestingly all three new funds are tilted toward the area of UK small cap that's benefited from recent trends; UK defence budget increases, AIM recovery, domestic growth optimism, and the AI-hype for those very small corners of the market.
It will be interesting to see if the Octopus & Marlborough funds continue to shine over the next 6 months, they can see some very volatile one-day moves.
· Since inception (Oct ’99) +2,126% vs FTSE Small Cap (ex-IT) Index + 381%
- Bonkers 3-Month Portfolio
3-Month Review
Bonkers 3-Month Portfolio: up 0.49%
FTSE World: down 0.70%
Review Period Performance Chart
Performance Table
Name | 3m | 6m | 1yr | 3yr | 5yr | Since Inception (Oct 99) |
|---|
Bonkers 3-Month Portfolio | 0.49 | 25.57 | 50.72 | 22.69 | -12.12 | 6,458.67 |
FTSE World | -0.70 | 1.13 | 17.07 | 50.24 | 71.45 | 732.69 |
Risk Table
Name | Worst Month (Since May 20) | 5 Year Volatility * | 5-Year Monthly VaR** |
|---|
Bonkers 3-Month Portfolio | -22.10 | 26.41 | -14.76 |
FTSE World | -6.54 | 11.38 | -5.02 |
Review Table
- Dynamic Commodities Portfolio
3-Month Review
Dynamic Commodities Portfolio: up 0.17%
Bloomberg Commodity Index: up 26.82%
Review Period Performance Chart
Performance Table
Name | 3m | 6m | 1yr | 3yr | 5yr | Since Inception (Jan 09) |
|---|
Dynamic Commodities Portfolio | 0.17 | 26.35 | 65.93 | 52.91 | 110.8 | 678.08 |
Bloomberg Commodity Index | 26.82 | 34.06 | 29.14 | 38.01 | 101.31 | 59.47 |
Risk Table
Name | Worst Month (Since May 20) | 5 Year Volatility * | 5-Year Monthly VaR** |
|---|
Dynamic Commodities Portfolio | -22.04 | 24.59 | -9.94 |
Bloomberg Commodity Index | -7.96 | 15.21 | -6.63 |
Review Table
- Dynamic Global Portfolio
6-Month Review
Dynamic Global Portfolio: down 8.38%
FTSE World Index: up 3.16%
Review Period Performance Chart
Performance Table
Name | 6m | 1yr | 3yr | 5yr | Since Inception (Oct 99) |
|---|
Dynamic Global Portfolio | -8.38 | 15.65 | 29.08 | 23.05 | 1,843.12 |
FTSE World Index | 3.16 | 17.07 | 50.24 | 71.45 | 732.69 |
Risk Table
Name | Worst Month (Since May 20) | 5 Year Volatility * | 5-Year Monthly VaR** |
|---|
Dynamic Global Portfolio | -10.73 | 12.44 | -6.44 |
FTSE World Index | -6.54 | 11.38 | -5.02 |
Review Table
- Dynamic UK Smaller Companies Portfolio
6-Month Review
Dynamic UK Smaller Companies Portfolio: down 10.32%
FTSE Small Cap (ex-IT) Index: down 1.66%
Review Period Performance Chart
Performance Table
Name | 6m | 1yr | 3yr | 5yr | Since Inception (Oct 99) |
|---|
Dynamic UK Smaller Companies Portfolio | -10.32 | 2.39 | 10.42 | -3.93 | 2,126.00 |
FTSE Small Cap (ex-IT) Index | -1.66 | 13.04 | 34.8 | 23.84 | 381.33 |
Risk Table
Name | Worst Month (Since May 20) | 5 Year Volatility * | 5-Year Monthly VaR** |
|---|
Dynamic UK Smaller Companies Portfolio | -12.65 | 14.63 | -5.55 |
FTSE Small Cap (ex-IT) Index | -11.29 | 14.39 | -5.82 |
Review Table
*A measure of the size and frequency of short-term changes in the value of an investment.
**Monthly Value at Risk (VaR). A VaR of 6% means that in 19 months out of 20 you should not, on average, expect a fall in the capital value of more than 6% in any one month. The VaR of a typical UK stock market fund is 6%, for reference.
Performance data as of 31/03/2026