As ever, if you have any questions about the below research please do not hesitate to contact us.
The new funds for each Dynamic Portfolio will be listed below, or alternatively you can view the new funds on the designated Portfolio Library page.
Performance Graphs will be over their review period unless stated otherwise.
The Dynamic Portfolio’s below are sorted A-Z.
Commentary
There are two Dynamic Portfolios up for review this month:
· Bonkers 6-Month Portfolio
· Dynamic Asia & EM Portfolio
Bonkers 6-Month Portfolio
There are periods that make you check the numbers twice. This is one of them. The Bonkers Portfolio returned 107% in just six months, driven by a blistering continuation of the gold miners' run, against a FTSE World return of 13% over the same period. That's a 94% gap, and quite possibly the widest differential we've ever recorded between this portfolio and global equities in a single six-month window. The portfolio stays in precious metals for the next period.
· Since inception (Sep 95) +45,964% vs FTSE World +1,441%
Dynamic Asia & EM Portfolio
The Bonkers Portfolio is in a category of its own, but the Dynamic Asia & EM Portfolio has had no less remarkable a period. A return of 68.2% in six months is by any measure extraordinary. Set against the MSCI Asia Pacific's already strong 22.7% over the same period, the 45% differential underscores just how powerfully the Dynamic process has worked in this environment. Two of the three funds remain in the portfolio for the next period.
· Since inception (March 99) +14,145% vs MSCI Asia Pacific +584%
- Bonkers 6-Month Portfolio
6-Month Review
Bonkers 6-Month Portfolio: up 106.93%
FTSE World: up 13.04%
Annual Performance Chart
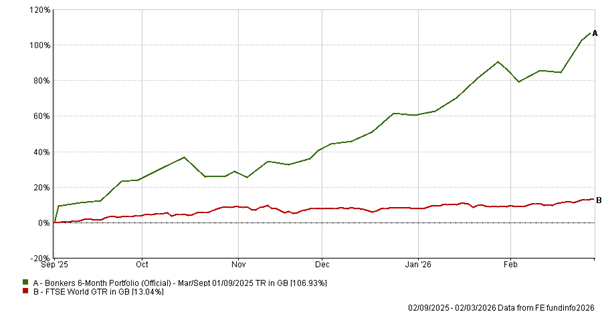
Performance Table
Name | 6m | 1yr | 3yr | 5yr | Since Inception
(Sep 95) |
|---|
Bonkers 6-Month Portfolio | 106.93 | 121.94 | 172.44 | 195.75 | 45,964.02 |
FTSE World | 13.04 | 17.91 | 63.43 | 93.51 | 1,441.14 |
Risk Table
Name | Worst Month (Since Apr 20) | 5 Year Volatility * | 5-Year Monthly VaR** |
|---|
Bonkers 6-Month Portfolio | -13.88 | 24.88 | -11.22 |
FTSE World | -6.54 | 11.13 | -4.96 |
Review Table
- Dynamic Asia & EM Portfolio
6-Month Review
Dynamic Asia & EM Portfolio: up 68.23%
MSCI AC Asia Pacific: up 22.65%
Annual Performance Chart
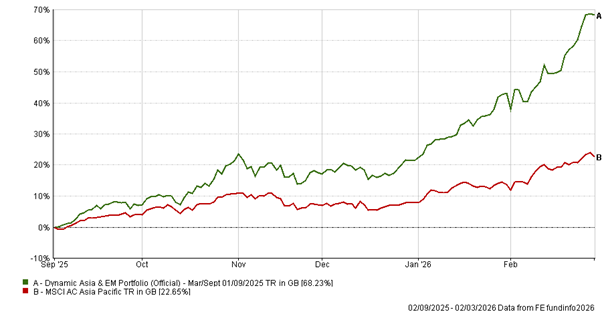
Performance Table
Name | 6m | 1yr | 3yr | 5yr | Since Inception (Mar 99) |
|---|
Dynamic Asia & EM Portfolio | 68.23 | 85.30 | 135.00 | 140.79 | 14,145.32 |
MSCI AC Asia Pacific | 22.65 | 36.22 | 59.27 | 47.26 | 584.30 |
Risk Table
Name | Worst Month (Since Apr 20) | 5 Year Volatility * | 5-Year Monthly VaR** |
|---|
Dynamic Asia & EM Portfolio | -10.02 | 17.71 | -5.29 |
MSCI AC Asia Pacific | -8.15 | 11.96 | -5.91 |
Review Table
*A measure of the size and frequency of short-term changes in the value of an investment.
**Monthly Value at Risk (VaR). A VaR of 6% means that in 19 months out of 20 you should not, on average, expect a fall in the capital value of more than 6% in any one month. The VaR of a typical UK stock market fund is 6%, for reference.
Performance data as of 28/02/2026