In our monthly Dynamic Portfolio review we provide some background commentary and insights, as well as performance tables & graphs, risk tables, and where to go to find the new funds for each Dynamic Portfolio.
As ever, if you have any questions about the below research please do not hesitate to contact us.
The new funds for each Dynamic Portfolio will be listed below, or alternatively you can view the new funds on the designated Portfolio Library page.
Performance Graphs will be over the review period unless stated otherwise.
The Dynamic Portfolio’s below are sorted A-Z.
Commentary
There are six Dynamic Portfolios up for review this month:
· Bonkers 3-Month Portfolio
· Bonkers 6-Month Portfolio – Jan-Jul
· Dynamic Asia (including ITs)
· Dynamic Cautious Portfolio
· Dynamic Commodities Portfolio
· Dynamic UK All Companies Portfolio
Bonkers 3-Month Portfolio
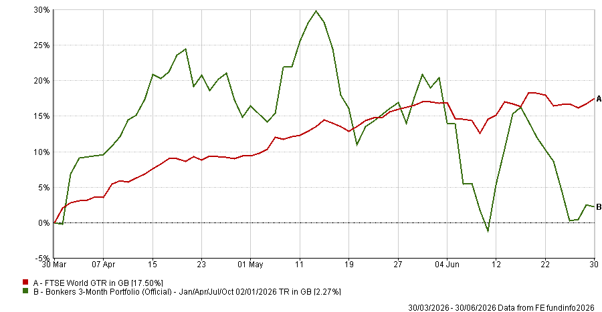
A disappointing three months for Bonkers, up 2.27% against the FTSE World's 17.50%. The portfolio has spent the recent period in energy which rode the Iran war and Strait of Hormuz closure, with oil spiking on supply fears, before the MOU and ceasefire pulled it back. The momentum has now moved on, rotating into Barings Korea, a market that has seen incredible returns as well as volatility as a result of concentration in its semiconductor and tech heavy names.
· Since inception (Oct '99) +6,623.66% vs FTSE World +859.07%
Bonkers 6-Month Portfolio
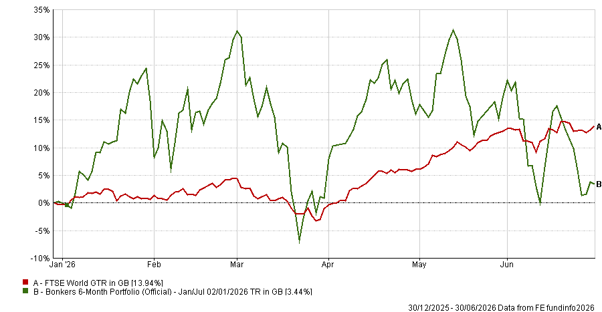
Up 3.44% over six months, but the one-year return of 90.12% is still extraordinary. WS Amati Strategic Metals is now one of the worst performers in the market as precious metals sell off, and so using momentum, this is cut and rotating into Barings Korea Trust alongside its three-month sibling. Both screens arriving at the same destination is worth noting.
Dynamic Asia (including ITs)
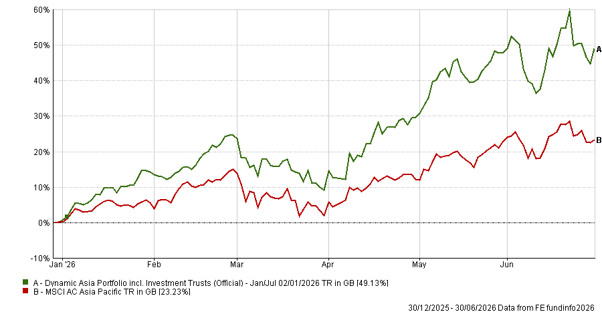
Up 49.13% against the MSCI Asia Pacific's 23.23%. An exceptional six months as Asia broadly surged, driven by Korea, Taiwan and China A shares. The portfolio now moves out of Pacific Horizon Investment Trust and into the Janus Henderson Asia Pacific ex-Japan index which by no surprise is heavily invested into South Korea and Taiwan, both of which have had an excellent six months.
· Since inception (Jan '00) +4,631.97% vs MSCI Asia Pacific +359.94%
Dynamic Cautious Portfolio
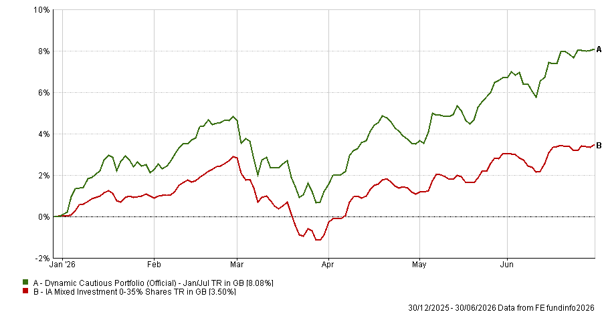
Up 8.08% against the sector average's 3.50%. A comfortable lead in what has been a decent period for cautious portfolios. All five funds change this review, with convertible bonds the dominant theme among the new holdings - a sensible place to be when equities have been strong but uncertainty remains elevated. Property also rotates, with CT Property Growth & Income replacing L&G Property as rate cut expectations continue to drip through.
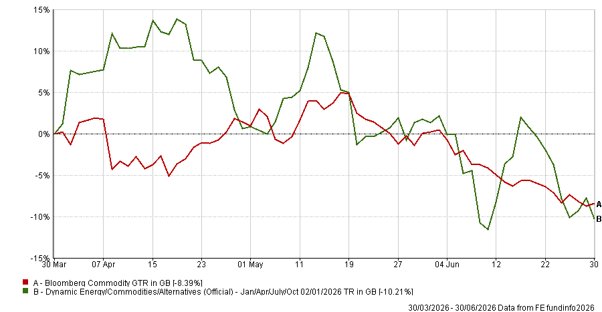
Dynamic Commodities Portfolio
Down 10.21% against the Bloomberg Commodities Index down 8.39%. A tough period all round as oil retreated from its Iran-war highs and metals continued to give back their 2025 gains. It’s a striking rotation for the next period, rotating out of traditional oil and gas funds entirely and into clean energy across the board.
· Since inception (Jan '09) +590.20% vs Bloomberg Commodities Index +45.73%
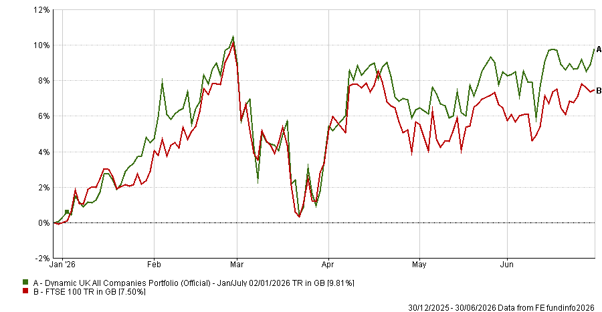
Dynamic UK All Companies Portfolio
Up 9.81% against the FTSE 100's 7.50%. The UK has been one of the stronger developed markets over the past year, and this portfolio has kept pace. Two of the three funds change, with JOHCM UK Growth and BNY Mellon UK Equity coming in. Dimensional UK Value is the one survivor and has been performing strongly for a while now – one to note.
· Since inception (Jul '94) +3,832.72% vs FTSE 100 +1,017.54%
- Bonkers 3-Month Portfolio
3-Month Review
Bonkers 3-Month Portfolio: up 2.27%
FTSE World Index: up 17.50%
Review Period Performance Chart
Performance Table
Name | 3m | 6m | 1yr | 3yr | 5yr | Since Inception (Oct 99) |
|---|
Bonkers 3-Month Portfolio | 2.27 | 4.14 | 41.63 | 14.28 | -18.21 | 6,623.66 |
FTSE World Index | 17.50 | 13.24 | 29.41 | 68.88 | 86.19 | 859.07 |
Risk Table
Name | Worst Month (Since Aug 20) | 5 Year Volatility * | 5-Year Monthly VaR** |
|---|
Bonkers 3-Month Portfolio | -22.10 | 27.80 | -15.05 |
FTSE World Index | -6.54 | 11.76 | -4.52 |
Review Table
- Bonkers 6-Month Portfolio
6-Month Performance
Bonkers 6-Months Portfolio: up 3.44%
FTSE World Index: up 13.94%
Review Period Performance Chart
Performance Table
Name | 6m | 1yr | 3yr | 5yr | Since Inception
(Jan 95) |
|---|
Bonkers 6-Month Portfolio - Jan-Jul | 3.44 | 90.12 | 165.02 | 206.72 | 34,916.52 |
FTSE World Index | 13.94 | 29.41 | 68.88 | 86.19 | 1,792.41 |
Risk Table
Name | Worst Month (Since Aug 20) | 5 Year Volatility * | 5-Year Monthly VaR** |
|---|
Bonkers 6-Month Portfolio - Jan-Jul | -22.10 | 30.99 | -12.48 |
FTSE World Index | -6.54 | 11.76 | -4.52 |
Review Table
- Dynamic Asia (including ITs) Portfolio
6-Month Performance
Dynamic Asia (including ITs) Portfolio: up 49.13%
MSCI Asia Pacific Index: up 23.23%
Review Period Performance Chart
Performance Table
Name | 6m | 1yr | 3yr | 5yr | Since Inception
(Jan 00) |
|---|
Dynamic Asia (including ITs) Portfolio | 49.13 | 71.16 | 73.53 | 83.89 | 4,631.97 |
MSCI Asia Pacific Index | 23.23 | 41.64 | 71.28 | 53.48 | 359.94 |
Risk Table
Name | Worst Month (Since Aug 20) | 5 Year Volatility * | 5-Year Monthly VaR** |
|---|
Dynamic Asia (including ITs) Portfolio | -12.47 | 19.03 | -6.68 |
MSCI Asia Pacific Index | -11.30 | 14.26 | -6.01 |
Review Table
- Dynamic Cautious Portfolio
6-Month Performance
Dynamic Cautious Portfolio: up 8.08%
(UT) Mixed Investment 0-35% Shares Sector Average: up 3.50%
Review Period Performance Chart
Performance Table
Name | 6m | 1yr | 3yr | 5yr | Since Inception
(Jan 00) |
|---|
Dynamic Cautious Portfolio | 8.08 | 13.49 | 32.36 | 7.07 | 288.13 |
Mixed Investment 0-35% Shares Sector Average | 3.50 | 8.68 | 22.71 | 11.25 | 155.99 |
Risk Table
Name | Worst Month (Since Aug 20) | 5 Year Volatility * | 5-Year Monthly VaR** |
|---|
Dynamic Cautious Portfolio | -7.64 | 7.14 | -1.95 |
Mixed Investment 0-35% Shares Sector Average | -4.55 | 5.55 | -1.39 |
Review
- Dynamic Commodities Portfolio
3-Month Performance
Dynamic Commodities Portfolio: down 10.21%
Bloomberg Commodities Index: down 8.39%
Review Period Performance Chart
Performance Table
Name | 3m | 6m | 1yr | 3yr | 5yr | Since Inception
(Jan 09) |
|---|
Dynamic Commodities Portfolio | -10.21 | -11.04 | 35.05 | 35.41 | 69.46 | 590.20 |
Bloomberg Commodities Index | -8.39 | 13.38 | 29.12 | 33.07 | 64.95 | 45.73 |
Risk Table
Name | Worst Month | 5 Year Volatility * | 5-Year Monthly VaR** |
|---|
Dynamic Commodities Portfolio | -22.04 | 25.19 | -10.76 |
Bloomberg Commodities Index | -7.96 | 15.43 | -6.96 |
Review Table
- Dynamic UK All Companies Portfolio
6-Month Performance
Dynamic UK All Companies Portfolio: up 9.81%
FTSE 100 Index: up 7.50%
Review Period Performance Chart
Performance Table
Name | 6m | 1yr | 3yr | 5yr | Since Inception
(Jul 94) |
|---|
Dynamic UK All Companies Portfolio | 9.81 | 24.36 | 72.50 | 79.97 | 3,832.72 |
FTSE 100 Index | 7.50 | 23.64 | 55.21 | 79.17 | 1,017.54 |
Risk Table
Name | Worst Month (Since Aug 20) | 5 Year Volatility * | 5-Year Monthly VaR** |
|---|
Dynamic UK All Companies Portfolio | -6.60 | 11.75 | -5.02 |
FTSE 100 Index | -6.18 | 10.08 | -4.20 |
Review Table
Performance data as of 30/06/2026
*A measure of the size and frequency of short-term changes in the value of an investment.
**Monthly Value at Risk (VaR). A VaR of 6% means that in 19 months out of 20 you should not, on average, expect a fall in the capital value of more than 6% in any one month. The VaR of a typical UK stock market fund is 6%, for reference.