As ever, if you have any questions about the below research please do not hesitate to contact us.
The new funds for each Dynamic Portfolio will be listed below, or alternatively you can view the new funds on the designated Portfolio Library page.
Performance Graphs will be over the review period unless stated otherwise.
The Dynamic Portfolio’s below are sorted A-Z.
Commentary
There are three Dynamic Portfolios up for review this month:
· Dynamic Japan 3-Month Portfolio
· Dynamic UK Blended Portfolio
· Dynamic World ex UK Portfolio
Dynamic Japan 3-Month Portfolio
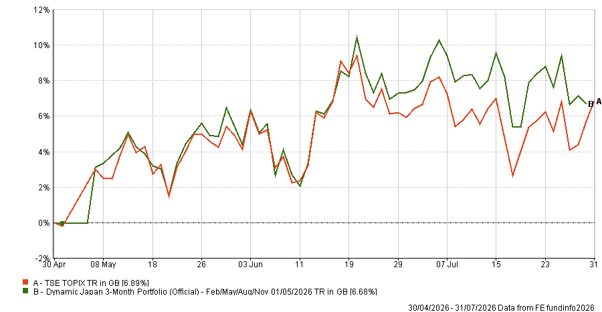
Essentially in line with the market over the past 3 months, up 6.68% against the Topix up 6.89%. Japan had a strong 3 months, with falling oil prices following the Iran ceasefire benefiting the world’s largest oil-importing economy. A rotation into a mid/smaller cap focused value fund – a shift that makes intuitive sense in this environment.
· Since inception (Feb '00) +674.98% vs TSE Topix +194.87%
Dynamic UK Blended Portfolio
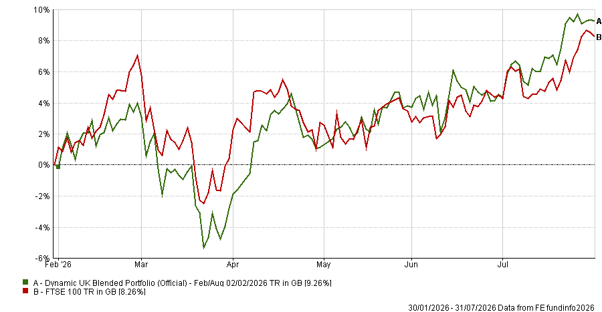
A solid six months, up 9.26% against the FTSE 100’s 8.26%. The UK has been quietly one of the better developed markets over the past year. This rotation is worth noting with two income-focused Fidelity funds making their way in, and Dimensional UK Value staying put. The FTSE 250 has hit new highs in recent days and is often seen as a better read on domestic confidence than the internationally weighted FTSE 100. One to keep an eye on.
· Since inception (Feb '00) +1,393.67% vs FTSE 100 +345.76%
Dynamic World ex UK Portfolio
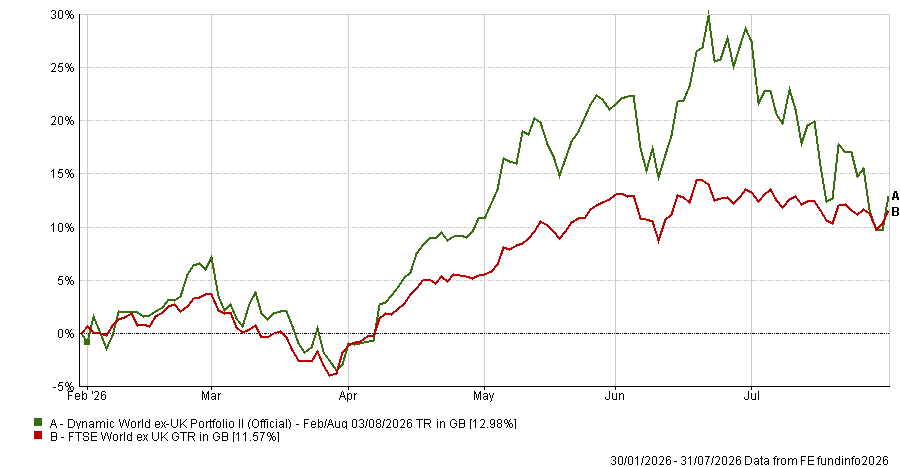
Up 12.98% against the FTSE World ex UK's 11.57%, a steady lead. All three funds change, and the rotation tells a story. US out, and Asia stays with another broad Asia Pacific fund as the momentum baton continues to pass from West to East. China rotates out as the domestic A-share run has been strong but has recently run out of steam, with Premier Miton European Opportunities coming in. Polar Capital Japan Value appears here too, independently of its arrival in the Dynamic Japan portfolio - flagging Japan value from two entirely different starting points.
· Since inception (Feb '00) +1,599.39% vs FTSE World ex UK +760.79%
- Dynamic Japan 3-Month Portfolio
3-Month Review
Dynamic Japan 3-Month Portfolio: up 6.68%
TSE Topix Index: up 6.89%
Review Period Performance Chart
Performance Table
Name | 3m | 6m | 1yr | 3yr | 5yr | Since Inception
(Feb 00) |
|---|
Dynamic Japan 3-Month Portfolio | 6.68 | 12.96 | 37.40 | 68.78 | 56.30 | 674.98 |
TSE Topix Index | 6.89 | 11.99 | 28.89 | 56.08 | 66.19 | 194.87 |
Risk Table
Name | Worst Month (Since Sep 20) | 5 Year Volatility * | 5-Year Monthly VaR** |
|---|
Dynamic Japan 3-Month Portfolio | -17.55 | 15.50 | -7.52 |
TSE Topix Index | -10.42 | 12.14 | -6.44 |
Review Table
- Dynamic UK Blended Portfolio
6-Month Performance
Dynamic UK Blended Portfolio: up 9.26%
FTSE 100 Index: up 8.26%
Review Period Performance Chart
Performance Table
Name | 6m | 1yr | 3yr | 5yr | Since Inception
(Feb 00) |
|---|
Dynamic UK Blended Portfolio | 9.26 | 21.41 | 58.35 | 66.97 | 1,393.67 |
FTSE 100 Index | 8.26 | 22.82 | 57.14 | 85.53 | 345.76 |
Risk Table
Name | Worst Month (Since Sep 20) | 5 Year Volatility * | 5-Year Monthly VaR** |
|---|
Dynamic UK Blended Portfolio | -8.11 | 12.56 | -4.83 |
FTSE 100 Index | -6.18 | 10.13 | -4.41 |
Review Table
- Dynamic World ex UK Portfolio
6-Month Performance
Dynamic World ex UK Portfolio: up 12.98%
FTSE World ex UK Index: up 11.57%
Review Period Performance Chart
Performance Table
Name | 6m | 1yr | 3yr | 5yr | Since Inception
(Feb 00) |
|---|
Dynamic World ex UK Portfolio | 12.98 | 24.01 | 67.54 | 78.29 | 1,599.39 |
FTSE World ex UK Index | 11.57 | 22.11 | 63.91 | 82.87 | 760.79 |
Risk Table
Name | Worst Month (Since Sep 20) | 5 Year Volatility * | 5-Year Monthly VaR** |
|---|
Dynamic World ex UK Portfolio | -12.20 | 16.21 | -6.74 |
FTSE World ex UK Index | -6.69 | 12.05 | -4.56 |
Review Table
Performance data as of 31/07/2026
*A measure of the size and frequency of short-term changes in the value of an investment.
**Monthly Value at Risk (VaR). A VaR of 6% means that in 19 months out of 20 you should not, on average, expect a fall in the capital value of more