As ever, if you have any questions about the below research please do not hesitate to contact us.
The new funds for each Dynamic Portfolio will be listed below, or alternatively you can view the new funds on the designated Portfolio Library page.
Performance Graphs will be over the review period unless stated otherwise.
The Dynamic Portfolio’s below are sorted A-Z.
Commentary
There are two Dynamic Portfolios up for review this month:
· Bonkers 6-month Portfolio
· Dynamic Asia and EM Portfolio
Bonkers 6-month Portfolio
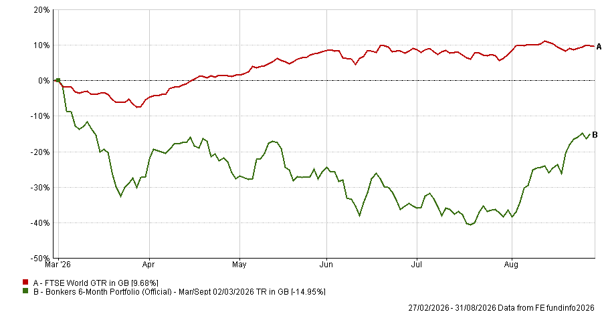
Down 14.95% against the FTSE World’s +9.68%, a painful six months for gold and precious metals as we’ve seen mass profit-taking after the extraordinary run through 2025. Living up to its name, even with this tricky 6-month period, the one-year return for Bonkers is still +75.99%. The portfolio now switches out of precious metals and into Taiwan – purely an AI play driven almost entirely by TSMC and the semiconductor complex. Bonkers being Bonkers.
· Since inception (Sep '95) +39,076.52% vs FTSE World +1,592.06%
Dynamic Asia and EM Portfolio
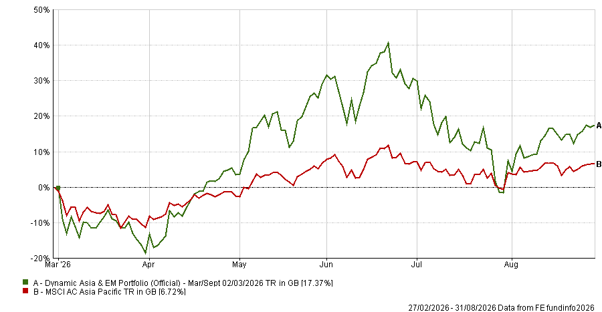
Up 17.37% against the MSCI AC Asia Pacific’s +6.72% - more than doubling the benchmark over six months, and a one-year return of +103.75% that underscores just how powerfully the Dynamic process has worked across Asia recently. All three funds change this review, with Korea exiting having delivered most of the returns over the year. It has had a volatile few months since, including several 10% falls in a single-day. Taiwan now sits at the heart of the portfolio with a few less concentrated Asia funds joining it.
· Since inception (Mar '99) +16,450.27% vs MSCI AC Asia Pacific +641.97%
- Bonkers 6-Month Portfolio
6-Month Review
Bonkers 6-Month Portfolio: down 14.95%
FTSE World Index: up 9.68%
Review Period Performance Chart
Performance Table
Name | 6m | 1yr | 3yr | 5yr | Since Inception (Sep 95) |
|---|
Bonkers 6-Month Portfolio | -14.95 | 75.99 | 137.94 | 133.58 | 39,076.52 |
FTSE World Index | 9.68 | 24.40 | 69.21 | 81.05 | 1,592.06 |
Risk Table
Name | Worst Month (Since Sep 20) | 5 Year Volatility * | 5-Year Monthly VaR** |
|---|
Bonkers 6-Month Portfolio | -27.10 | 32.27 | -13.01 |
FTSE World Index | -6.54 | 11.78 | -4.06 |
Review Table
Old fund | New fund |
|---|
SVS Baker Steel Gold & Precious Metals | JPM Taiwan |
- Dynamic Asia and EM Portfolio
6-Month Review
Dynamic Asia and EM Portfolio: up 17.37%
MSCI AC Asia Pacific: up 6.72%
Review Period Performance Chart
Performance Table
Name | 6m | 1yr | 3yr | 5yr | Since Inception (Mar 99) |
|---|
Dynamic Asia and EM Portfolio | 17.37 | 103.75 | 155.27 | 174.97 | 16,450.27 |
MSCI AC Asia Pacific | 6.72 | 33.55 | 70.64 | 56.51 | 641.97 |
Risk Table
Name | Worst Month (Since Sep 20) | 5 Year Volatility * | 5-Year Monthly VaR** |
|---|
Dynamic Asia and EM Portfolio | -18.58 | 26.71 | -9.08 |
MSCI AC Asia Pacific | -11.30 | 14.02 | -5.75 |
Review Table
Performance data as of 31/08/2026
*A measure of the size and frequency of short-term changes in the value of an investment.
**Monthly Value at Risk (VaR). A VaR of 6% means that in 19 months out of 20 you should not, on average, expect a fall in the capital value of more than 6% in any one month. The VaR of a typical UK stock market fund is 6%, for reference.