As ever, if you have any questions about the below research please do not hesitate to contact us.
The new funds for each Dynamic Portfolio will be listed below, or alternatively you can view the new funds on the designated Portfolio Library page.
Performance Graphs will be over the review period unless stated otherwise.
The Dynamic Portfolio’s below are sorted A-Z.
Commentary
There are four Dynamic Portfolios up for review this month:
Bonkers 3-Month Portfolio
Dynamic Commodities Portfolio
Dynamic Global Portfolio
Dynamic UK Smaller Companies Portfolio
Bonkers 3-Month Portfolio
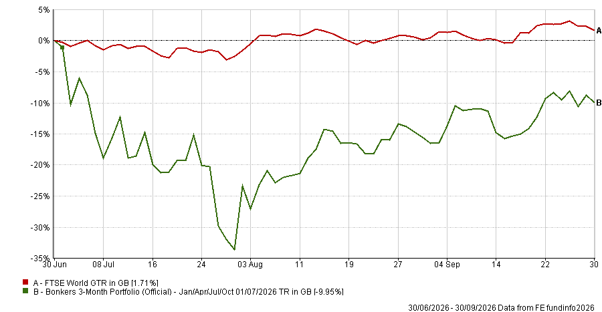
Down 9.95% against the FTSE World's +1.71%. A difficult three months as Korea struggled to find its footing after the extreme volatility that gripped the Korean market earlier this year. The five-year numbers of this Bonkers Portfolio make uncomfortable reading, though living up to its name, the since-inception figure of 5,601.87% is still extraordinary.
The rotation this month is out of Korea, into Ninety One Global Gold. Gold was featuring in the worst fund tables just a few months ago, but momentum returned, particularly for the miners.
Dynamic Commodities Portfolio
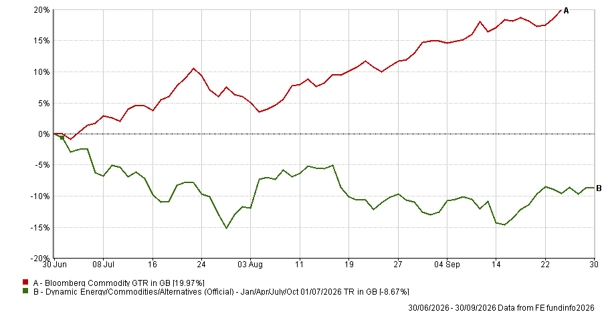
Down 8.67% against the Bloomberg Commodity Index's extraordinary 19.97%. A brutal three months driven entirely by the portfolio's clean energy positioning. In July's review we noted the screen had made a clean sweep into clean energy, and it has now made an equally clean sweep back out, which shows the nature of this portfolio.
All three clean energy funds exit, and all three replacements are gold and precious metals. The US policy gutting of clean energy subsidies proved a sustained headwind. With commodities up nearly 20% in a quarter, the portfolio was simply in the wrong place, but nonetheless, since inception this portfolio is up nearly 8x the index.
Dynamic Global Portfolio
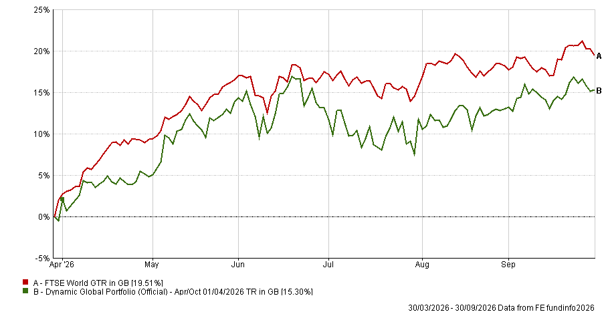
Up 15.30% against the FTSE World's 19.51%. A reasonable six months in absolute terms, though lagging the benchmark. Three funds rotate, and the direction is interesting after months of leaning heavily into Asia/Europe and away from the US. Alger American Asset Growth arrives, bringing US (tech) exposure back into the portfolio for the first time in several review cycles. Europe and Japan exit, making way for two Fidelity Asian funds.
Dynamic UK Smaller Companies Portfolio
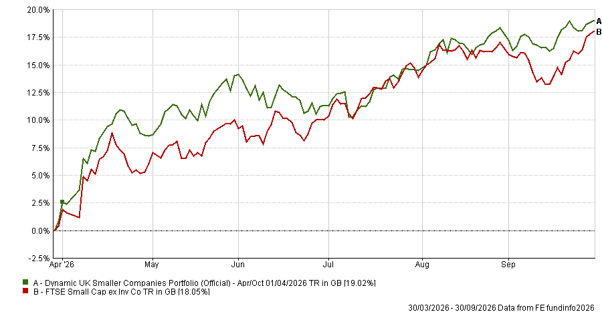
Up 19.02% against the FTSE Smallcap's 18.05%. A strong six months for UK small caps broadly - is confidence finally returning? The rotation moves up the size spectrum: micro-cap and nano-cap funds exit entirely, replaced by more mainstream smaller company names and, notably, Thesis Stonehage Fleming AIM. AIM has had a torrid few years, battered by IHT uncertainty and liquidity issues, but the momentum is building. Whether that marks a genuine turn for the market is one to watch.
- Bonkers 3-Month Portfolio
3-Month Review
Bonkers 3-Month Portfolio: down 9.95%
FTSE World Index: up 1.71%
Review Period Performance Chart
Performance Table
Name | 3m | 6m | 1yr | 3yr | 5yr | Since Inception (Oct 99) |
|---|
Bonkers 3-Month Portfolio | -9.95 | -13.27 | 9.17 | -2.53 | -20.51 | 5,601.87 |
FTSE World Index | 1.71 | 20.22 | 21.58 | 72.69 | 87.92 | 875.51 |
Risk Table
Name | Worst Month (Since Nov 20) | 5 Year Volatility * | 5-Year Monthly VaR** |
|---|
Bonkers 3-Month Portfolio | -23.43 | 29.10 | -16.04 |
FTSE World Index | -6.54 | 11.68 | -4.10 |
Review Table
- Dynamic Commodities Portfolio
3-Month Performance
Dynamic Commodities Portfolio: down 8.67%
Bloomberg Commodity Index: up 19.97%
Review Period Performance Chart
Performance Table
Name | 3m | 6m | 1yr | 3yr | 5yr | Since Inception (Jan 09) |
|---|
Dynamic Commodities Portfolio | -8.67 | -10.86 | 11.27 | 37.41 | 54.56 | 584.01 |
Bloomberg Commodity Index | 19.97 | 9.90 | 47.34 | 46.82 | 78.97 | 74.83 |
Risk Table
Name | Worst Month (Since Nov 20) | 5 Year Volatility * | 5-Year VaR ** |
|---|
Dynamic Commodities Portfolio | -22.04 | 24.97 | -10.53 |
Bloomberg Commodity Index | -7.96 | 15.70 | -6.51 |
Review Table
- Dynamic Global Portfolio
6-Month Performance
Dynamic Global Portfolio: up 15.30%
FTSE World Index: up 19.51%
Review Period Performance Chart
Performance Table
Name | 6m | 1yr | 3yr | 5yr | Since Inception (Oct 99) |
|---|
Dynamic Global Portfolio | 15.30 | 6.18 | 51.95 | 31.57 | 2,150.03 |
FTSE World Index | 19.51 | 21.58 | 72.69 | 87.92 | 875.51 |
Risk Table
Name | Worst Month (Since Nov 20) | 5 Year Volatility * | 5-Year VaR ** |
|---|
Dynamic Global Portfolio | -10.73 | 13.02 | -6.07 |
FTSE World Index | -6.54 | 11.68 | -4.10 |
Review Table
- Dynamic UK Smaller Companies Portfolio
Dynamic UK Smaller Companies Portfolio: up 19.02%
FTSE Smallcap (ex-IT) Index: up 18.05%
Review Period Performance Chart
Performance Table
Name | 6m | 1yr | 3yr | 5yr | Since Inception (Oct 99) |
|---|
Dynamic UK Smaller Companies | 19.02 | 5.85 | 33.15 | -0.69 | 2,527.43 |
FTSE Smallcap (ex-IT) Index | 18.05 | 15.62 | 50.49 | 28.29 | 465.88 |
Risk Table
Name | Worst Month (Since Nov 20) | 5 Year Volatility * | 5-Year VaR ** |
|---|
Dynamic UK Smaller Companies | -12.65 | 14.88 | -4.40 |
FTSE Smallcap (ex-IT) Index | -11.29 | 14.30 | -4.20 |
Review Table
Performance data as of 30/09/2026
*A measure of the size and frequency of short-term changes in the value of an investment.
**Monthly Value at Risk (VaR). A VaR of 6% means that in 19 months out of 20 you should not, on average, expect a fall in the capital value of more than 6% in any one month. The VaR of a typical UK stock market fund is 6%, for reference.