As ever, if you have any questions about the below research please do not hesitate to contact us.
The new funds for each Dynamic Portfolio will be listed below, or alternatively you can view the new funds on the designated Portfolio Library page.
Performance Graphs will be over the review period unless stated otherwise.
The Dynamic Portfolio’s below are sorted A-Z.
Commentary
There are three portfolios up for review this month:
· Dynamic Japan 3-Month
· Dynamic UK Blended
· Dynamic World ex-UK
Dynamic Japan 3-Month
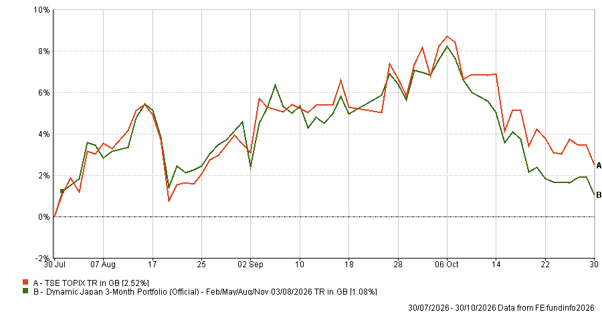
A modest quarter for this portfolio, up 1.08% against the Topix’s 2.52%. Going into October the portfolio (and index) was on a strong run, then spent the month giving back what the two before had built. Not a period to shout about, but Japan has had an excellent if volatile year, and the direction of travel is still positive. The rotation stays within value, but adds an income tilt as the portfolio moves into WS Zennor Japan Equity Income.
· Since inception (February 2000): +683.32% vs TSE Topix +198.94%
Dynamic UK Blended
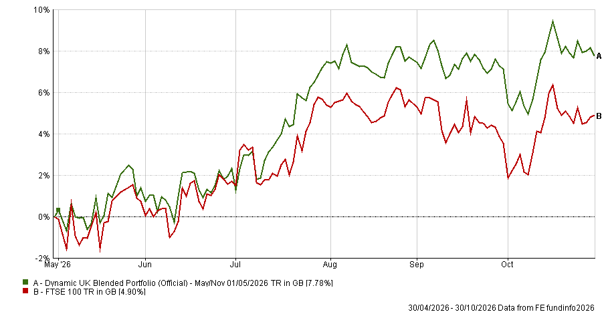
A strong six months, up 7.78% against the FTSE 100’s 4.90%. But the story here is the rotation, not just the return as all three funds change, and they change in one direction - smaller companies. Unicorn UK Smaller Companies and Aberforth UK Small Companies both arrive, replacing the income and value names from the May review, with VT Castlebay UK Equity completing the new line-up. Momentum has pivoted decisively toward the smaller end of the market. With the FTSE 250 having hit new highs and UK domestic confidence building, momentum appears to be catching a genuine shift in where the energy in UK equities now sits. Watch this space…
· Since inception (May 2000): +2,305.23% vs FTSE 100 +337.38%
Dynamic World ex UK
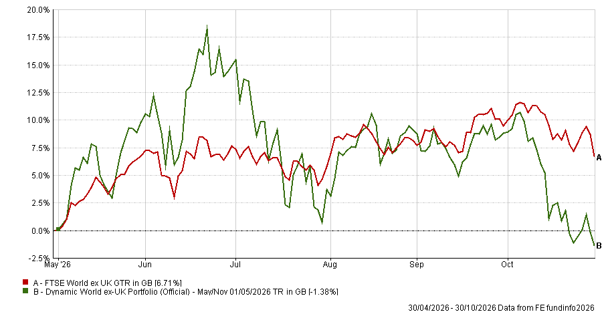
Down 1.38% against the FTSE World ex-UK’s 6.71%. An exceptional start to the 6-month period for this portfolio, which was then all given back as Asia struggled. Tech has dominated the region (particularly in Korea/Taiwan) and momentum there has drained sharply in recent months, which is reflected in a rotation out of Asia and China. What arrives in their place is US Value, US Smaller Companies, and another Japan fund which shows a decisive pivot toward smaller and value across the globe. With UK Blended making a similar move toward value/smallers this month, two entirely independent screens are pointing in the same direction.
· Since inception (May 2000): +1,196.12% vs FTSE World ex-UK +709.96%
- Dynamic Japan 3-Month Portfolio
3-Month Review
Dynamic Japan 3-Month Portfolio: up 1.08%
TSE Topix Index: up 2.52%
Review Period Performance Chart
Performance Table
Name | 3m | 6m | 1yr | 3yr | 5yr | Since Inception (Feb 00) |
|---|
Dynamic Japan 3-Month Portfolio | 1.08 | 7.83 | 18.54 | 86.55 | 51.73 | 683.32 |
TSE Topix Index | 2.52 | 8.36 | 17.63 | 61.96 | 62.80 | 198.94 |
Risk Table
| Worst Month (Since Dec 20) | 5 Year Volatility * | 5-Year Monthly VaR** |
|---|
Dynamic Japan 3-Month Portfolio | -17.55 | 15.66 | -7.55 |
TSE Topix Index | -10.42 | 11.95 | -6.24 |
Review Table
- Dynamic UK Blended Portfolio
6-Month Performance
Dynamic UK Blended Portfolio: up 7.78%
FTSE 100 Index: up 4.90%
Review Period Performance Chart
Performance Table
Name | 6m | 1yr | 3yr | 5yr | Since Inception (May 00) |
|---|
Dynamic UK Blended Portfolio | 7.78 | 15.22 | 60.89 | 43.65 | 2,305.23 |
FTSE 100 Index | 4.90 | 13.42 | 62.52 | 77.31 | 337.38 |
Risk Table
Name | Worst Month (Since Dec 20) | 5 Year Volatility * | 5-Year Monthly VaR** |
|---|
Dynamic UK Blended Portfolio | -8.26 | 11.97 | -4.95 |
FTSE 100 Index | -6.18 | 10.19 | -4.21 |
Review Table
- Dynamic World ex UK Portfolio
6-Month Performance
Dynamic World ex UK Portfolio: down 1.38%
FTSE World ex-UK Index: up 6.71%
Review Period Performance Chart
Performance Table
Name | 6m | 1yr | 3yr | 5yr | Since Inception (May 00) |
|---|
Dynamic World ex-UK Portfolio | -1.38 | 3.96 | 61.99 | 28.29 | 1,196.12 |
FTSE World ex-UK Index | 6.71 | 12.72 | 72.82 | 75.94 | 709.96 |
Risk Table
Name | Worst Month (Since Dec 20) | 5 Year Volatility * | 5-Year Monthly VaR** |
|---|
Dynamic World ex-UK Portfolio | -12.94 | 17.68 | -7.77 |
FTSE World ex-UK Index | -6.69 | 11.97 | -4.22 |
Review Table
Performance data as of 31/10/2026
*A measure of the size and frequency of short-term changes in the value of an investment.
**Monthly Value at Risk (VaR). A VaR of 6% means that in 19 months out of 20 you should not, on average, expect a fall in the capital value of more than 6% in any one month. The VaR of a typical UK stock market fund is 6%, for reference.