 The 4th anniversary of the launch of Neil Woodford’s inaugural fund, Woodford Equity Income, is on the 2nd June. He had a good start but then hit rough water in 2016/7. How has he fared since then?
Neil Woodford left Invesco Perpetual in 2013 and now manages 3 funds under the Woodford brand: Equity Income, Patient Capital, and Income Focus. His loyal following pumped up the fund size, which peaked at around £10.3bn in 2017. Since then it has fallen to around £6.6bn.
As we approach 4 years, how has the fund fared? Here are some facts:
- Since June 2014 the fund is up 23.22%.
- On a total return basis (with income re-invested), this lags the sector average by 9.5%. See chart 1 & table 1 below.
- His old Invesco funds are lagging on a smaller scale
Over the last 12 months his struggles are notable…
- Woodford is down 9.76%
- In comparison, the sector is up 6.69% and the FTSE 100 index is up 9.32%
- Woodford Equity Income underperforms the sector average by over 16%...
- …and the FTSE 100 index by over 19% (chart 2).
Worse still, Neil’s fund has also horribly underperformed our preferred equity income funds over the last year. For example, he generated 27% less than Schroder Income, and 26% less than JOHCM UK Equity Income – these are shocking differences.
Woodford Equity Income has underperformed but so has his legacy (if we take that to be the Invesco High Income fund). There are much better opportunities for income and growth investors. We mentioned these previously here and here.
ACTION FOR INVESTORS
- The fund has struggled for the last two years.
- Underperformance and loss of momentum over the last year is a major concern for holders of this fund.
- Don’t let fund manager loyalty blind you to the better opportunities out there.
FURTHER READING
Table 1: Annualized and total return since inception & current fund size
| |
Growth % |
|
| |
Annualized return |
Total return |
Fund Size (£m) |
| Invesco Perpetual High Income |
5.22 |
22.15 |
9,370.5 |
| LF Woodford Equity Income |
5.46 |
23.22 |
6,664.8 |
| |
|
|
|
| FTSE 100 |
7.84 |
34.54 |
|
| UT UK Equity Income |
7.48 |
32.72 |
|
Table 2: Annual performance periods
| |
19/6/14-2/6/15 |
3/6/15-2/6/16 |
3/6/16-2/6/17 |
3/6/17-22/5/18 |
Total return |
| LF Woodford Equity Income |
20.04 |
-0.19 |
14.13 |
-10.87 |
23.22 |
| FTSE 100 |
5.21 |
-7.38 |
26.39 |
8.47 |
34.54 |
| UT UK Equity Income |
9.76 |
-4.71 |
19.54 |
5.46 |
32.72 |
Total return: 19/6/14-22/5/18
Chart 1: Performance since inception
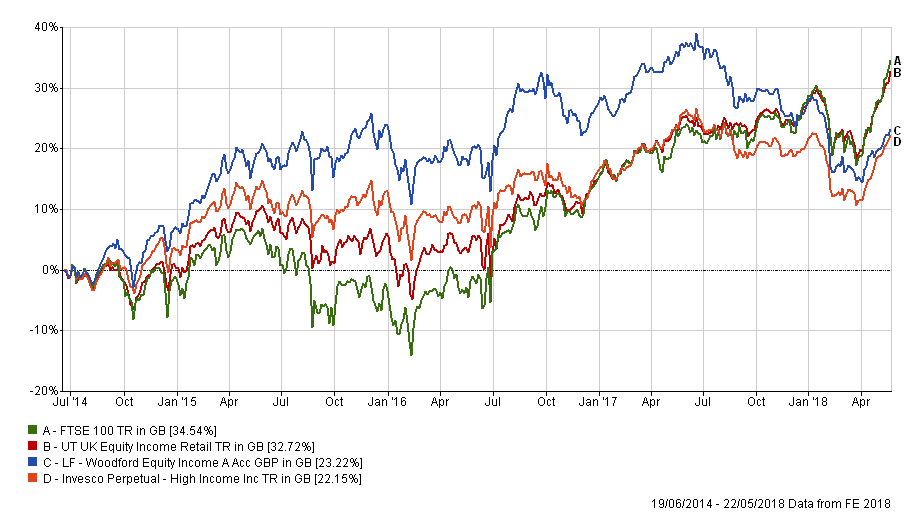
Chart 2: Performance over the last 12 months
.png)
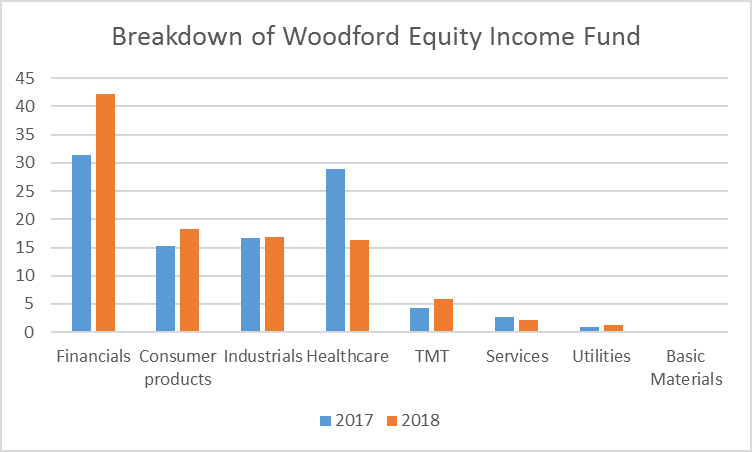
Chart 3: Breakdown of Woodford Equity Income (2017 vs 2018)